How to choose child care in Canberra
About
Finding the right childcare centre is one of the bigger decisions parents make. You want somewhere safe, somewhere your child will thrive. But how do you actually tell which centres are safer than others?
We analysed over 1,000 regulatory documents released by the ACT Government covering childcare incidents, complaints, and enforcement actions from 2020 to 2025. This is what we found. The team made multiple attempts to retrieve the full 2000+ documents proported to be released. We were unsuccessful at identifying over 2000 unique documents from official sources.
What do we mean by "Harm" documents?
Throughout this article, "harm" refers to documents in the regulatory corpus that discuss physical harm to a child or sexual behaviour. This doesn't mean harm occurred in every case—some documents discuss allegations that weren't substantiated, or near-misses that were reported as required. It only indicates that something serious was reported or investigated.
We calculated harm rates as "harm documents per 100 childcare places per year." This would provide a skewed view if the analysis specifically interrogated individual centers as many services have less than 20 places. The focus of this analysis is anchored to suburbs and districts.
What about non-harm documents?
Nearly all of the documents that don't pertain to harm are staff to child ratio breaches. Breaches of this nature have been the focus of many recent media articles and further analysis didn't provide much additional insights.
The short version
Look at these:
- NQS ratings for Quality Area 6 (Family Partnerships), Quality Area 5 (Relationships with Children), and Quality Area 1 (Educational Program). Centres rated "Working Towards" in these areas have 3-4 times higher harm rates than "Exceeding" centres.
- Service type matters. Long Day Care centres have the highest harm rates. Preschools and Outside School Hours Care have much lower rates.
Don't rely on these:
- Expensive centres aren't safer.
- Wealthy areas don't have lower harm rates.
- Neighbourhood crime doesn't predict childcare safety.
- The size of the child care doesn't strictly link to harm rates.
Three NQS ratings are important
The National Quality Standard (NQS) rates childcare services across seven Quality Areas. Every centre gets an overall rating: Exceeding, Meeting, or Working Towards.
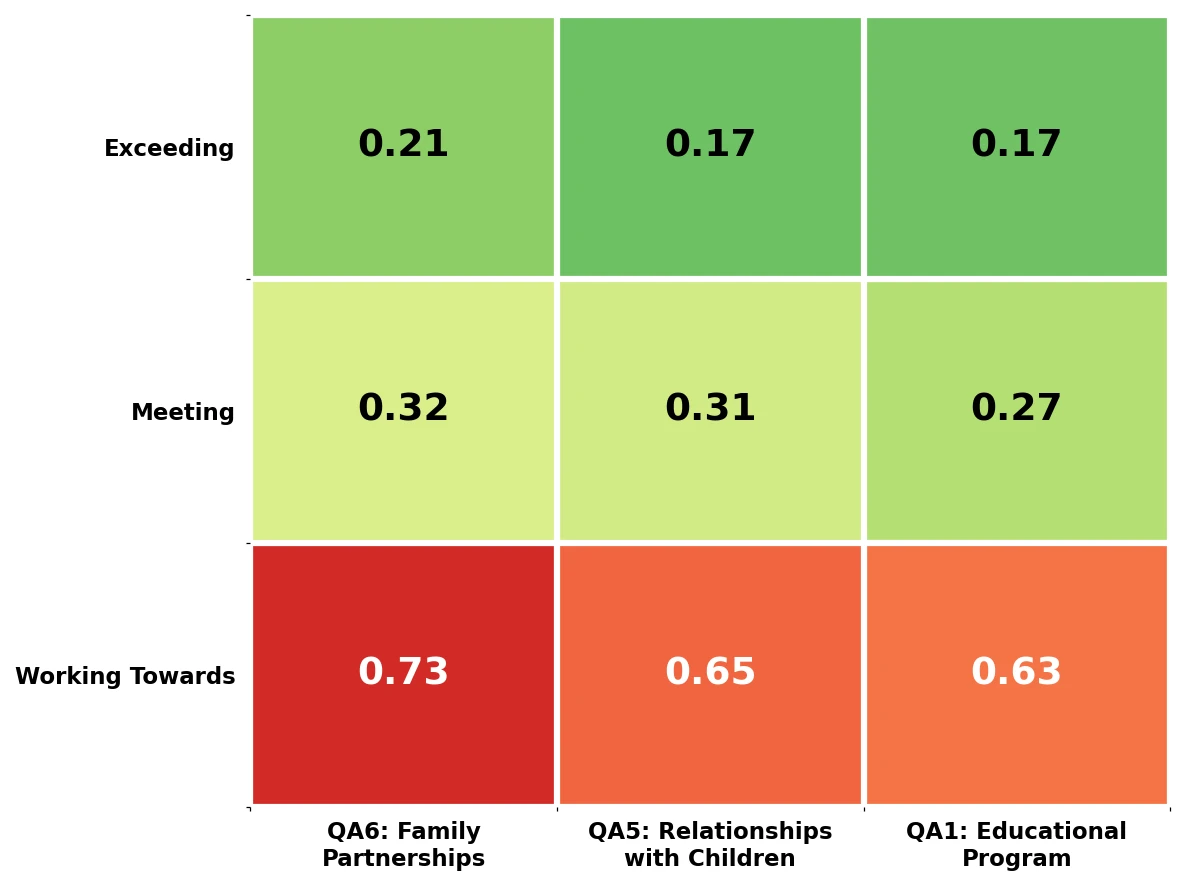
Not all Quality Areas predict safety equally. Three stand out:
- Quality Area 6 — Family Partnerships
- Quality Area 5 — Relationships with Children
- Quality Area 1 — Educational Program
Centres rated "Working Towards" in these areas have harm rates 3-4 times higher than "Exceeding" centres.
The overall NQS rating also matters: Exceeding centres have a harm rate of 0.19, while Working Towards centres sit at 0.56.
Other Quality Areas (Health & Safety, Physical Environment, Governance) show smaller differences between rating levels, making them less useful for distinguishing safe from unsafe centres.
What to do: When evaluating a centre, check its NQS ratings on the Starting Blocks website. Pay particular attention to QA6, QA5, and QA1. A "Working Towards" rating in any of these is a warning sign.
Service type matters
| Service Type | Harm Rate | Notes |
|---|---|---|
| Long Day Care | 0.45 | Highest rate—full-day care for 0-5 year olds |
| Long Day Care + OSHC | 0.38 | Combined services |
| Outside School Hours Care | 0.08 | Before/after school care |
| Preschool/Kindergarten | 0.01 | Lowest rate—sessional programs |
Long Day Care centres have harm rates roughly 6 times higher than Outside School Hours Care and 45 times higher than preschools.
This likely reflects the age of children (younger children require more supervision and are more vulnerable), the hours of care (full days vs sessions), and the nature of activities.
What to do: If you have options, understand that different service types carry different risk profiles. This doesn't mean Long Day Care is unsafe, it means the regulatory burden is higher and you should scrutinise these centres more carefully.
What doesn't predict safety
We tested several factors that parents might assume matter. They don't.
Price: More expensive centres aren't safer. The correlation between daily fees and harm rates is essentially zero. There is a mild skew towards mid-tier daily pricing of $160 per day to $180 per day.
Suburb income: Areas with higher median incomes don't have lower harm rates. Income explains less than 1% of the variation in harm rates across suburbs.
Local crime rates: Neighbourhood assault and sexual offence rates don't predict childcare harm rates. A centre in a high-crime suburb isn't more dangerous than one in a low-crime suburb.
Centre size: The relationship between capacity and harm is weak and inconsistent. Very small centres (under 50 places) have lower rates, but beyond that, size doesn't predict much.
Your district at a glance
Harm rates vary across Canberra's districts. Here's how they compare, using the pooled harm rate described above.
| District | Services | Capacity | Harm Rate | Est. Revenue Range (LDC) |
|---|---|---|---|---|
| Molonglo Valley | 7 | 775 | 1.83 | $5.3M–$7.1M |
| North Canberra | 29 | 1,862 | 0.81 | $13.2M–$17.7M |
| Tuggeranong | 71 | 4,995 | 0.64 | $50.9M–$67.9M |
| Belconnen | 79 | 6,507 | 0.60 | $69.8M–$93.1M |
| Canberra Central | 58 | 4,933 | 0.60 | $47.9M–$63.8M |
| Gungahlin | 54 | 6,160 | 0.58 | $87.7M–$116.9M |
| Weston Creek | 20 | 1,742 | 0.38 | $19.4M–$25.9M |
| Woden Valley | 39 | 2,970 | 0.28 | $30.4M–$40.5M |
Revenue estimates are rough order of magnitude (ROM ±30%) for Long Day Care only, based on publicly available pricing and standard occupancy assumptions. Canberra Airport (1 service, 112 places) is excluded as a single-centre outlier.
Within each district, harm rates vary significantly by suburb. Some suburbs have zero harm documents over five years; others have rates several times the district average. The sections below give a snapshot of each district.
Belconnen
The largest district by service count. 79 services across 6,507 places, with a pooled harm rate of 0.60. Median household income is $1,104/week, with 18.5% of the population aged 0–14.
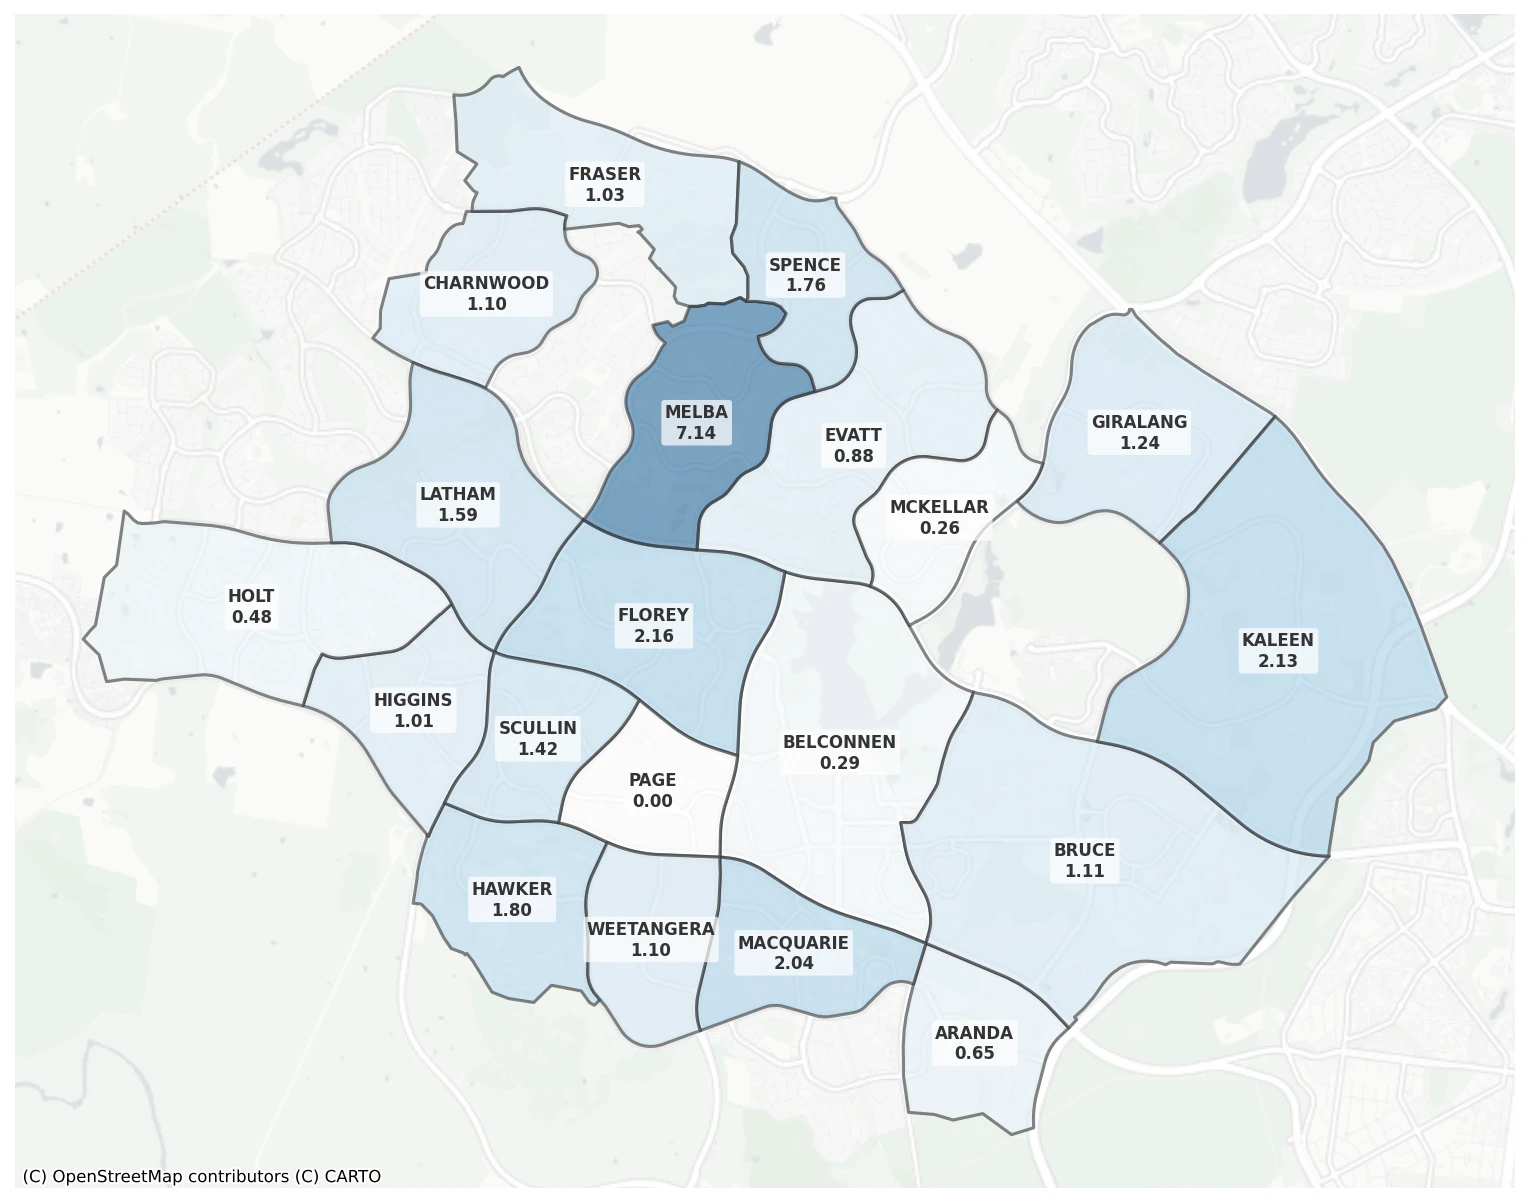
Harm incidents here skew toward sexual behaviour (42%) and physical harm (32%), with 30% involving multiple children. Melba (7.14) and Florey (2.16) are the highest-rate suburbs; Page recorded zero harm documents over five years.
Gungahlin
Canberra's young-families corridor. 54 services, 6,160 places, harm rate 0.58. Median income $1,207/week, with the second-highest proportion of children (23.5% aged 0–14). Average daily LDC price is $181—the highest in the ACT.
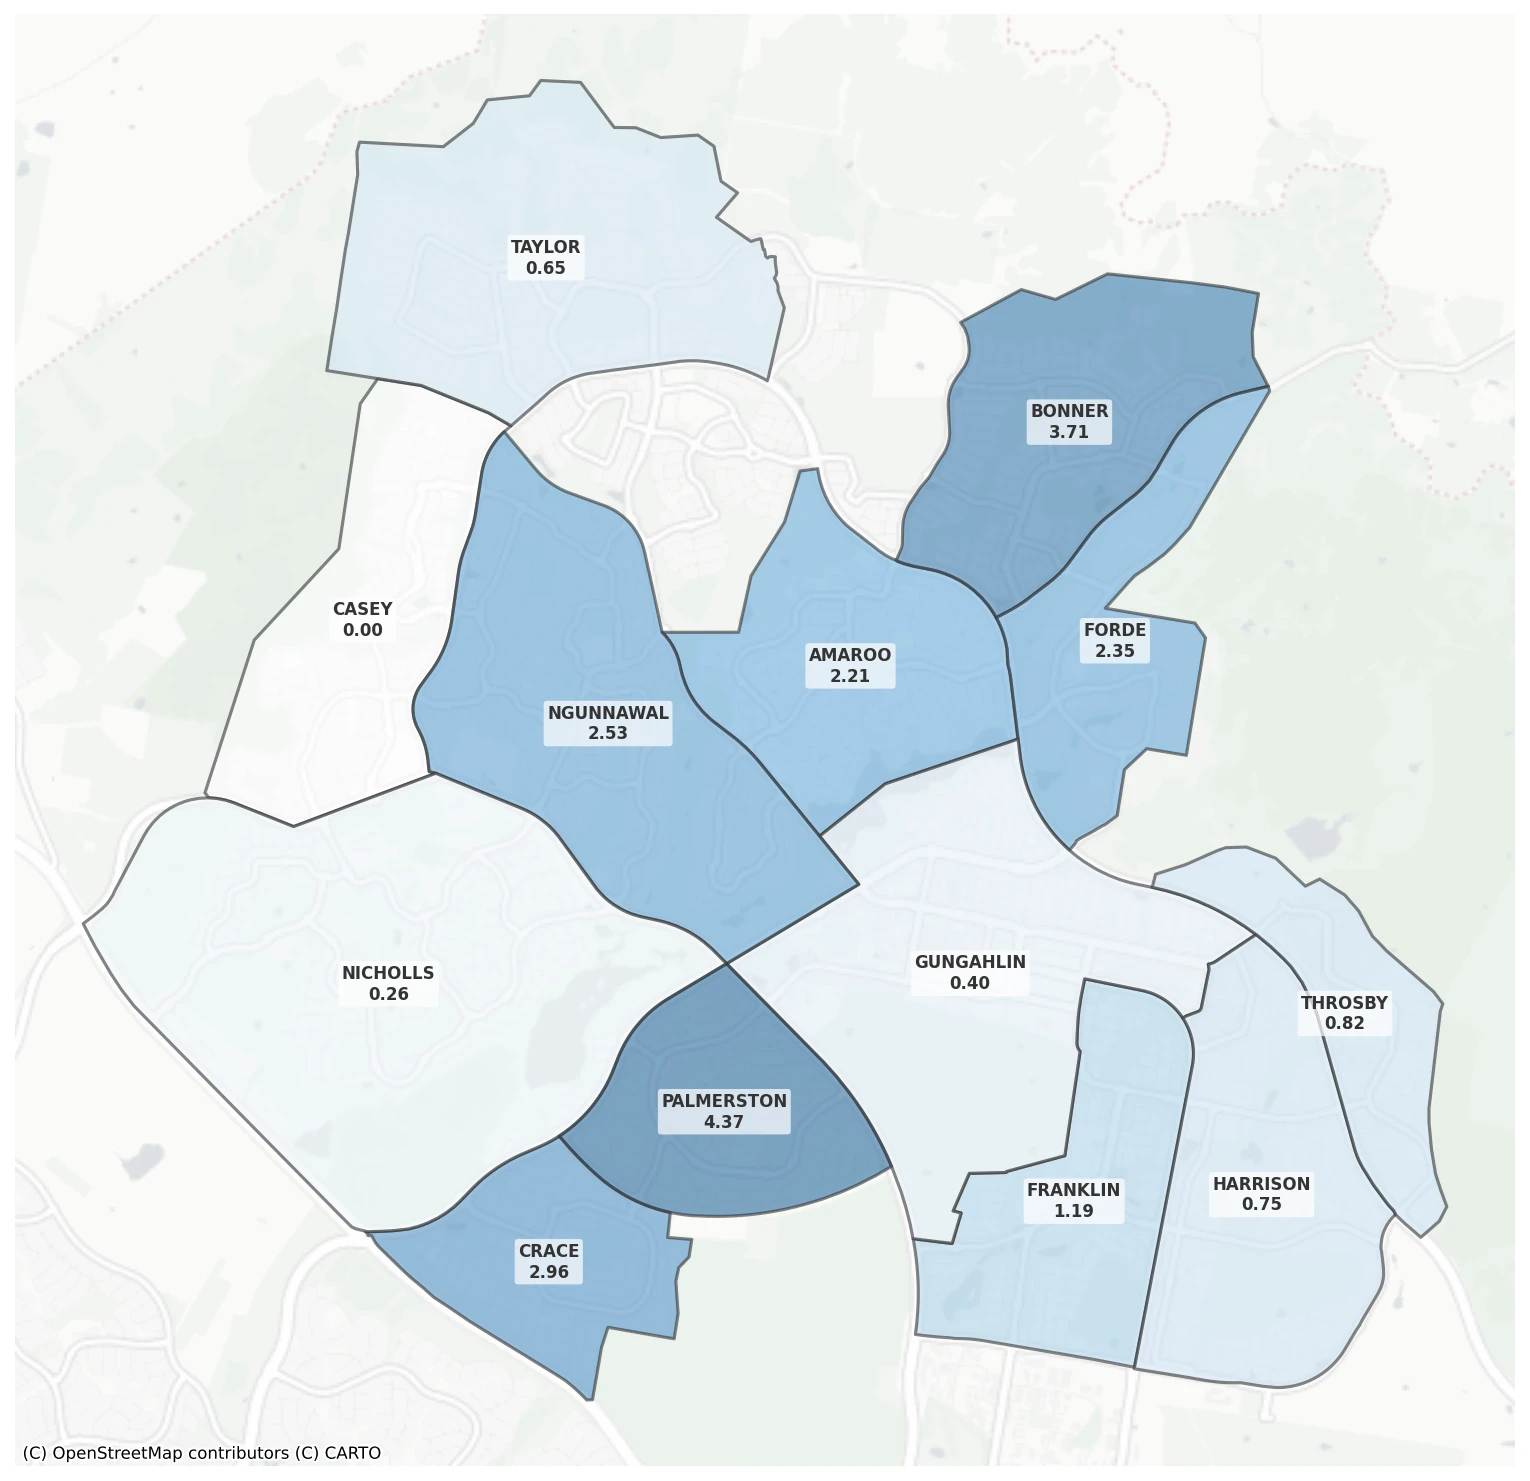
Sexual behaviour flags appear in 43% of harm documents, and 33% involve multiple children. Palmerston (4.37) and Bonner (3.71) are the hotspots; Casey recorded zero harm documents.
Tuggeranong
The southern suburbs. 71 services, 4,995 places, harm rate 0.64. Median income $1,160/week. This district has the highest enforcement rate of the larger districts—8% of harm documents resulted in a penalty, with another 3% receiving conditional directions.
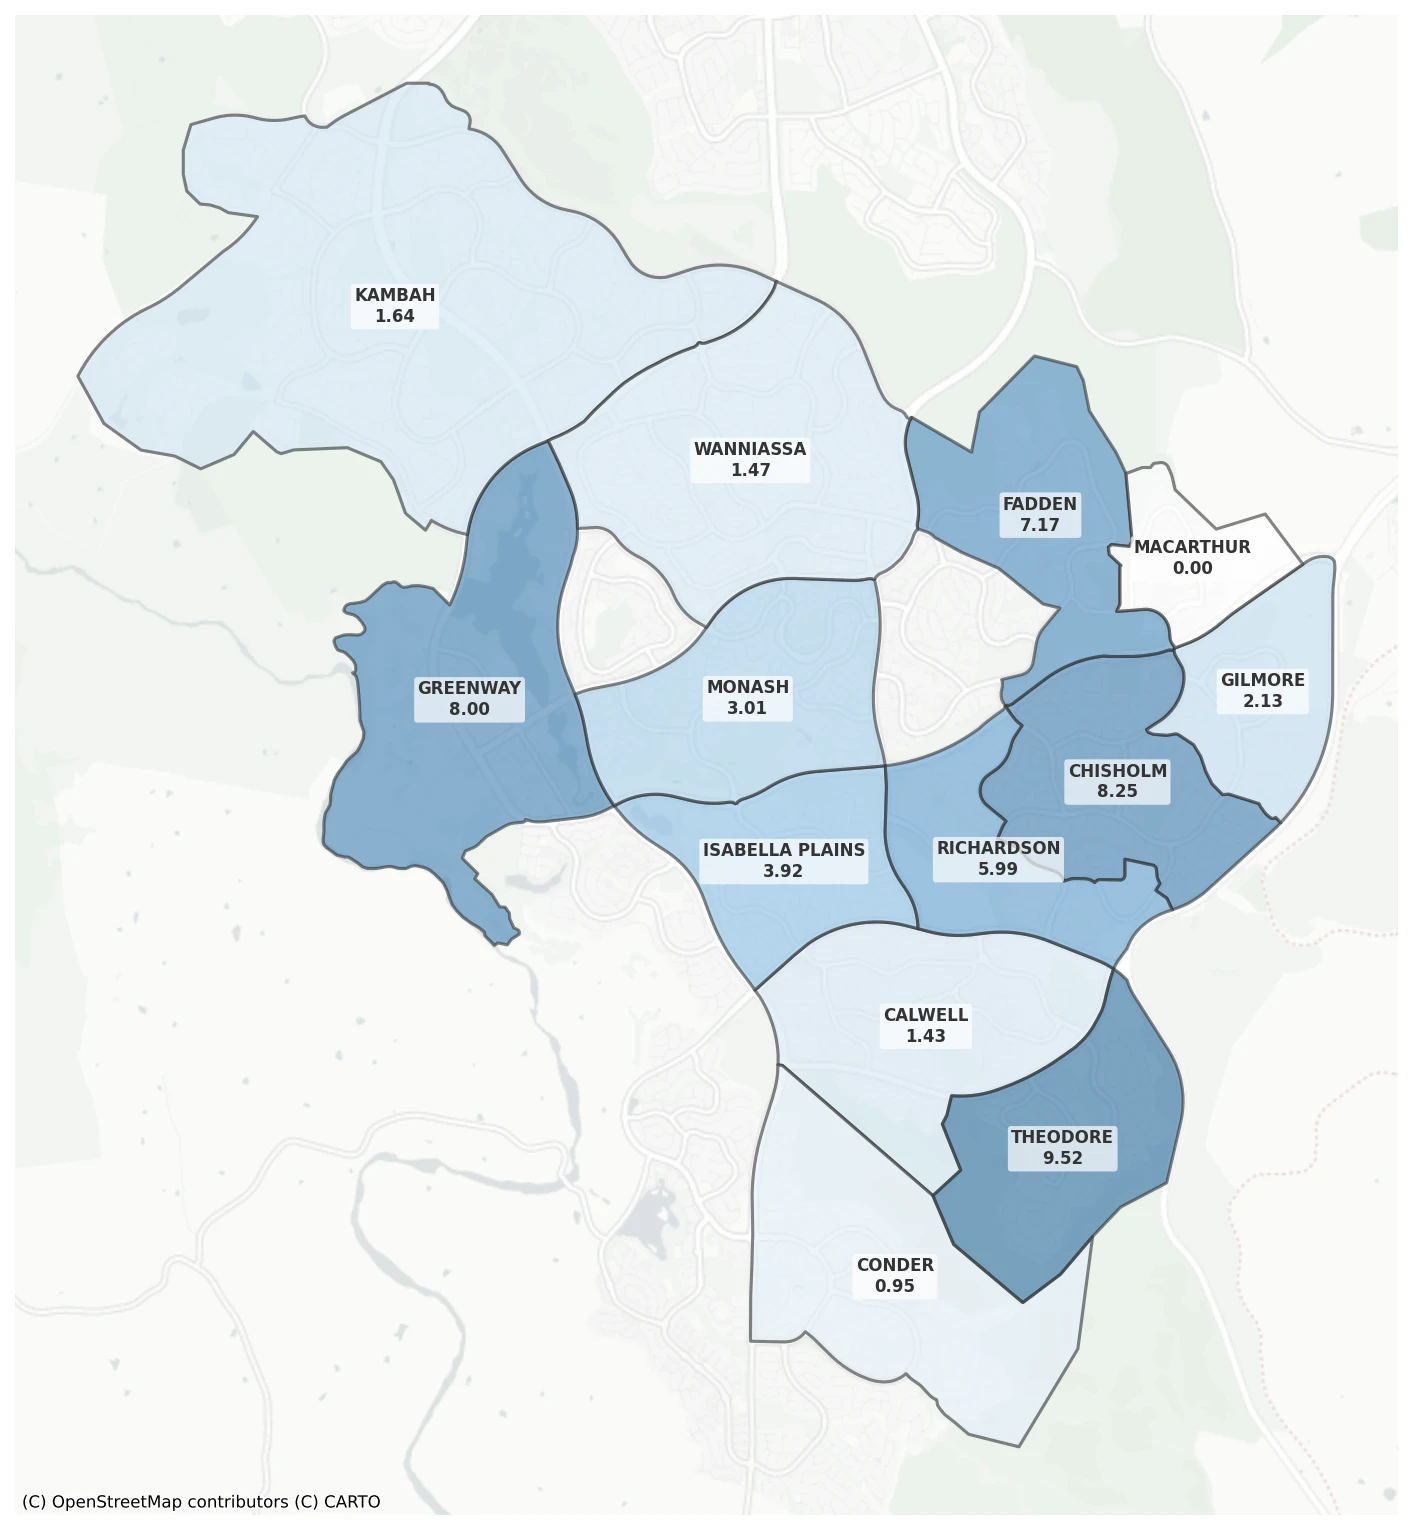
Theodore (9.52), Chisholm (8.25), and Greenway (8.00) are the highest-rate suburbs. Macarthur recorded zero harm documents. Recurrence was documented in 11% of cases.
Canberra Central
The inner suburbs. 58 services, 4,933 places, harm rate 0.60. Median income $1,512/week, the highest of any district. Average LDC price is $120/day—the lowest in the ACT.
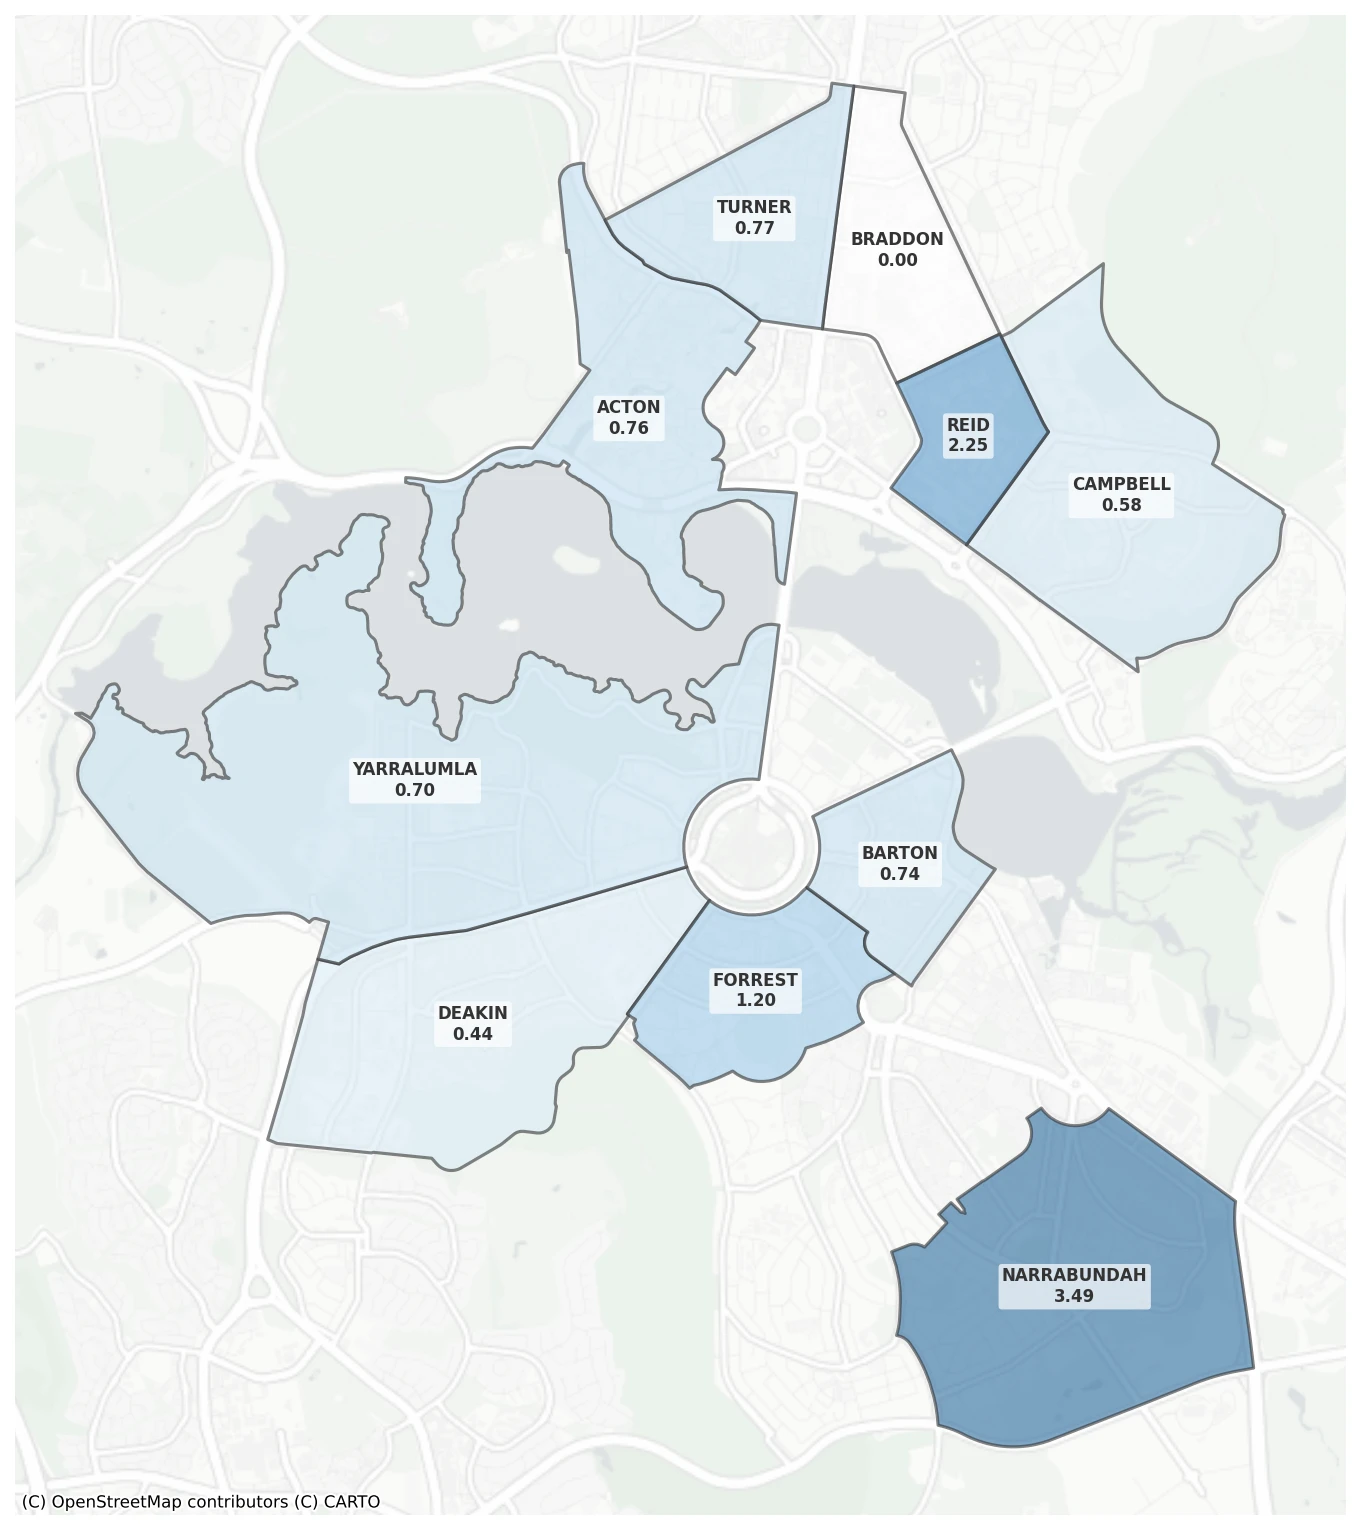
This district has the highest recurrence rate (18% of harm documents) and a notable concentration in Narrabundah (3.49). Braddon recorded zero harm documents across 3 services and 259 places.
North Canberra
29 services, 1,862 places, harm rate 0.81; the second highest among the established districts. Median income $1,261/week. Enforcement is notably low: only 1% of harm documents resulted in a penalty.
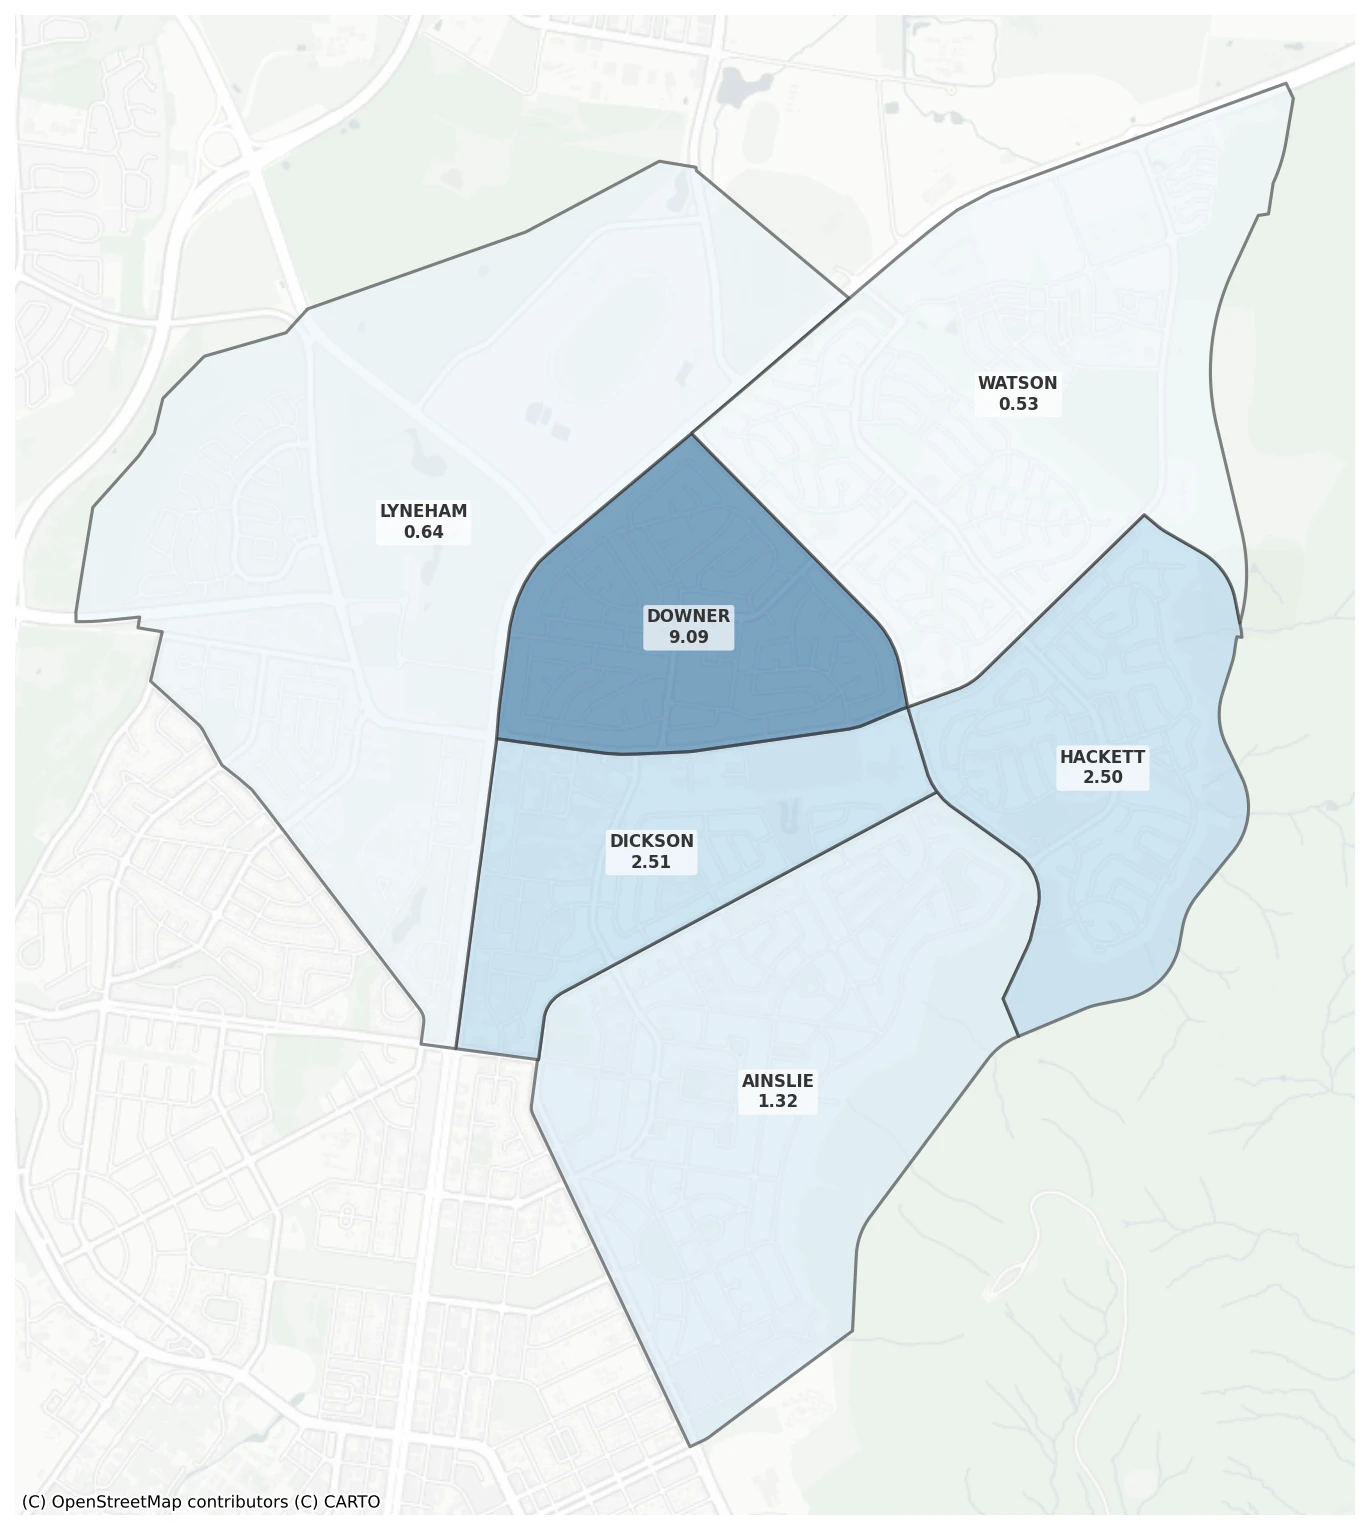
Downer (9.09) has the highest rate but is based on a single 22-place service. Dickson (2.51) is the more statistically meaningful hotspot with 7 services and 471 places. Outdoor incidents account for 45% of harm documents—the highest proportion of any district.
Weston Creek
20 services, 1,742 places, harm rate 0.38. Median income $1,242/week. A quieter district with only 33 harm documents over five years. Recurrence is very low (3%) and multi-child involvement (15%) is the lowest of any district.
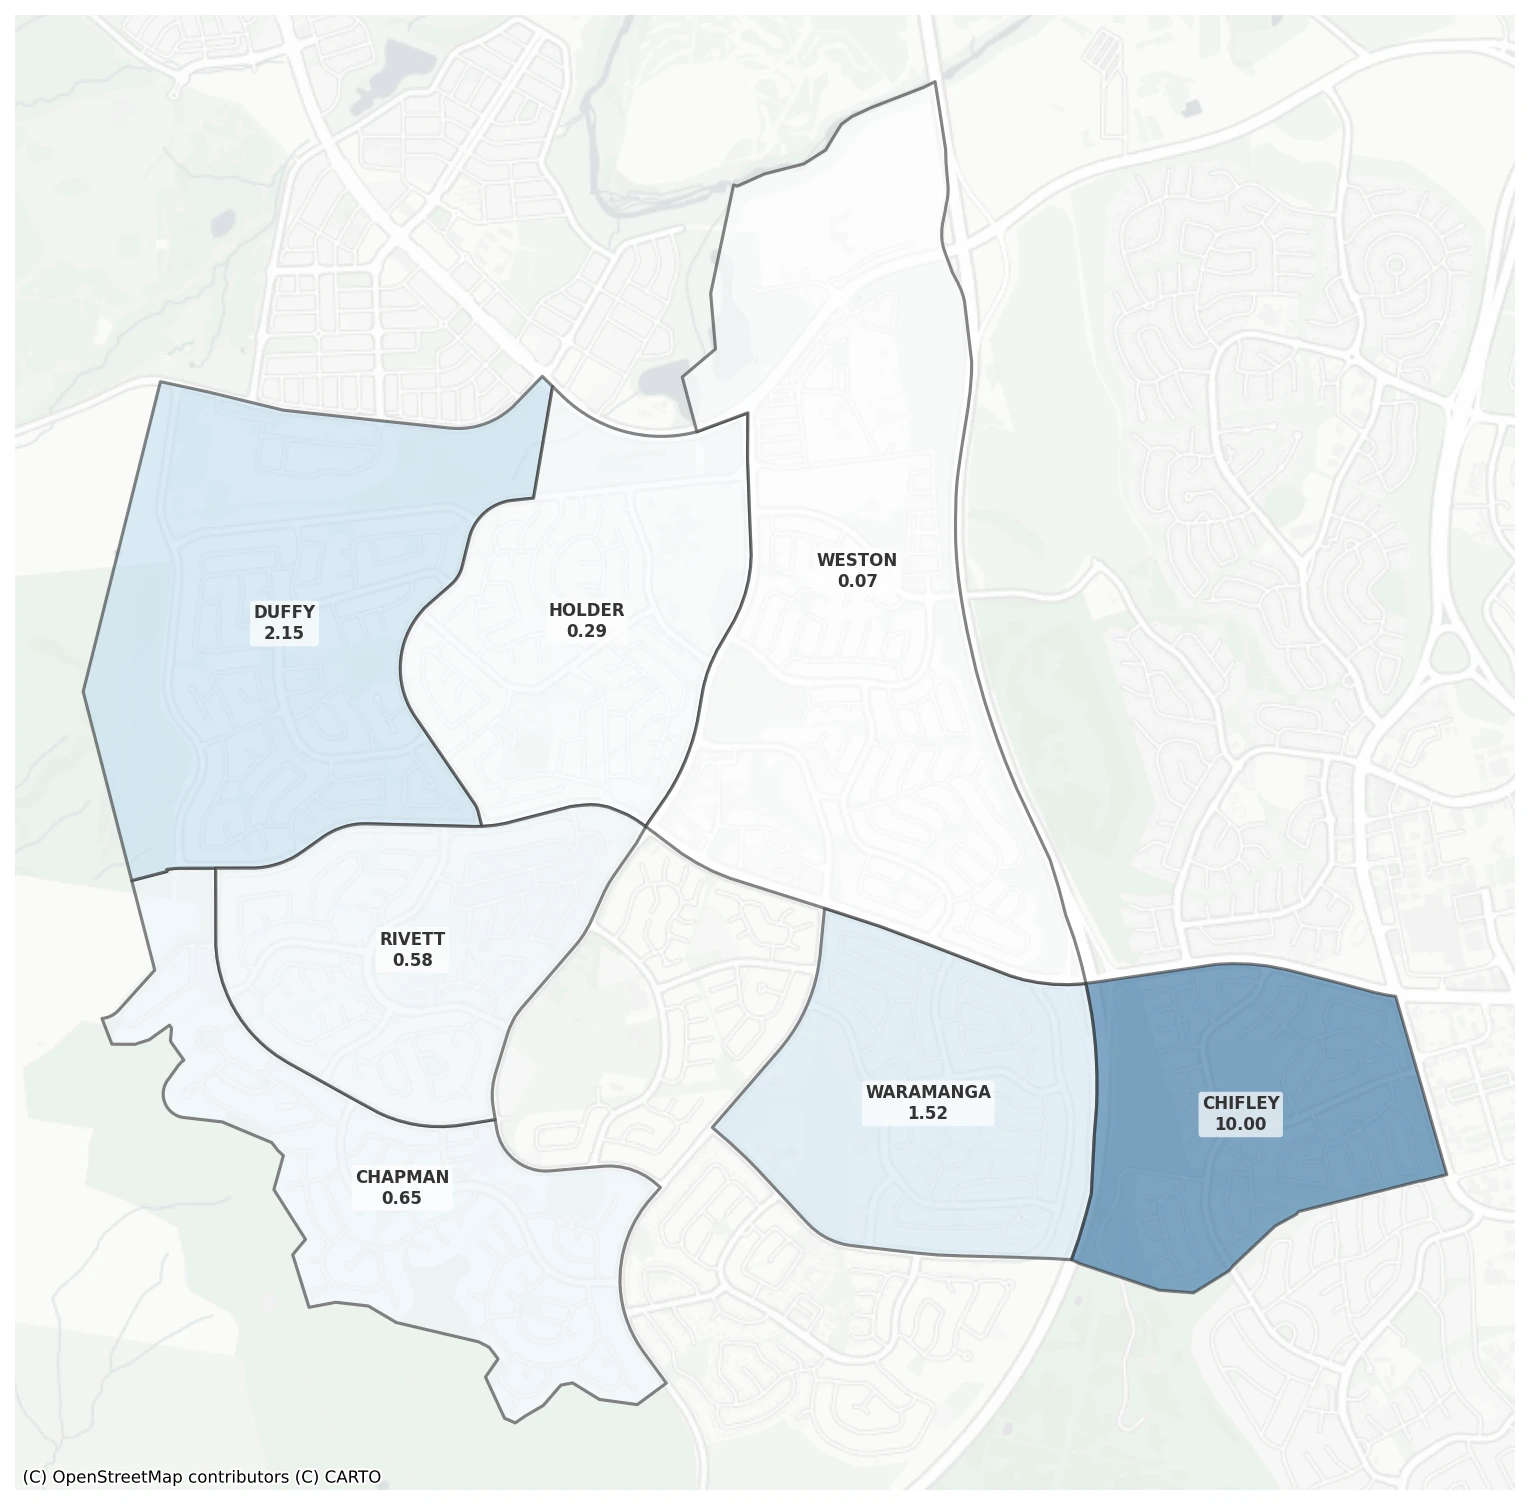
Chifley (10.00) stands out but is based on just 2 services with 22 total places. Weston (0.07) and Holder (0.29) are among the safest suburbs in the ACT.
Woden Valley
The safest district. 39 services, 2,970 places, harm rate 0.28. Median income $1,292/week. Despite the low harm rate, Woden Valley has the highest enforcement intensity, 12% of harm documents resulted in a penalty and 7% received conditional directions.
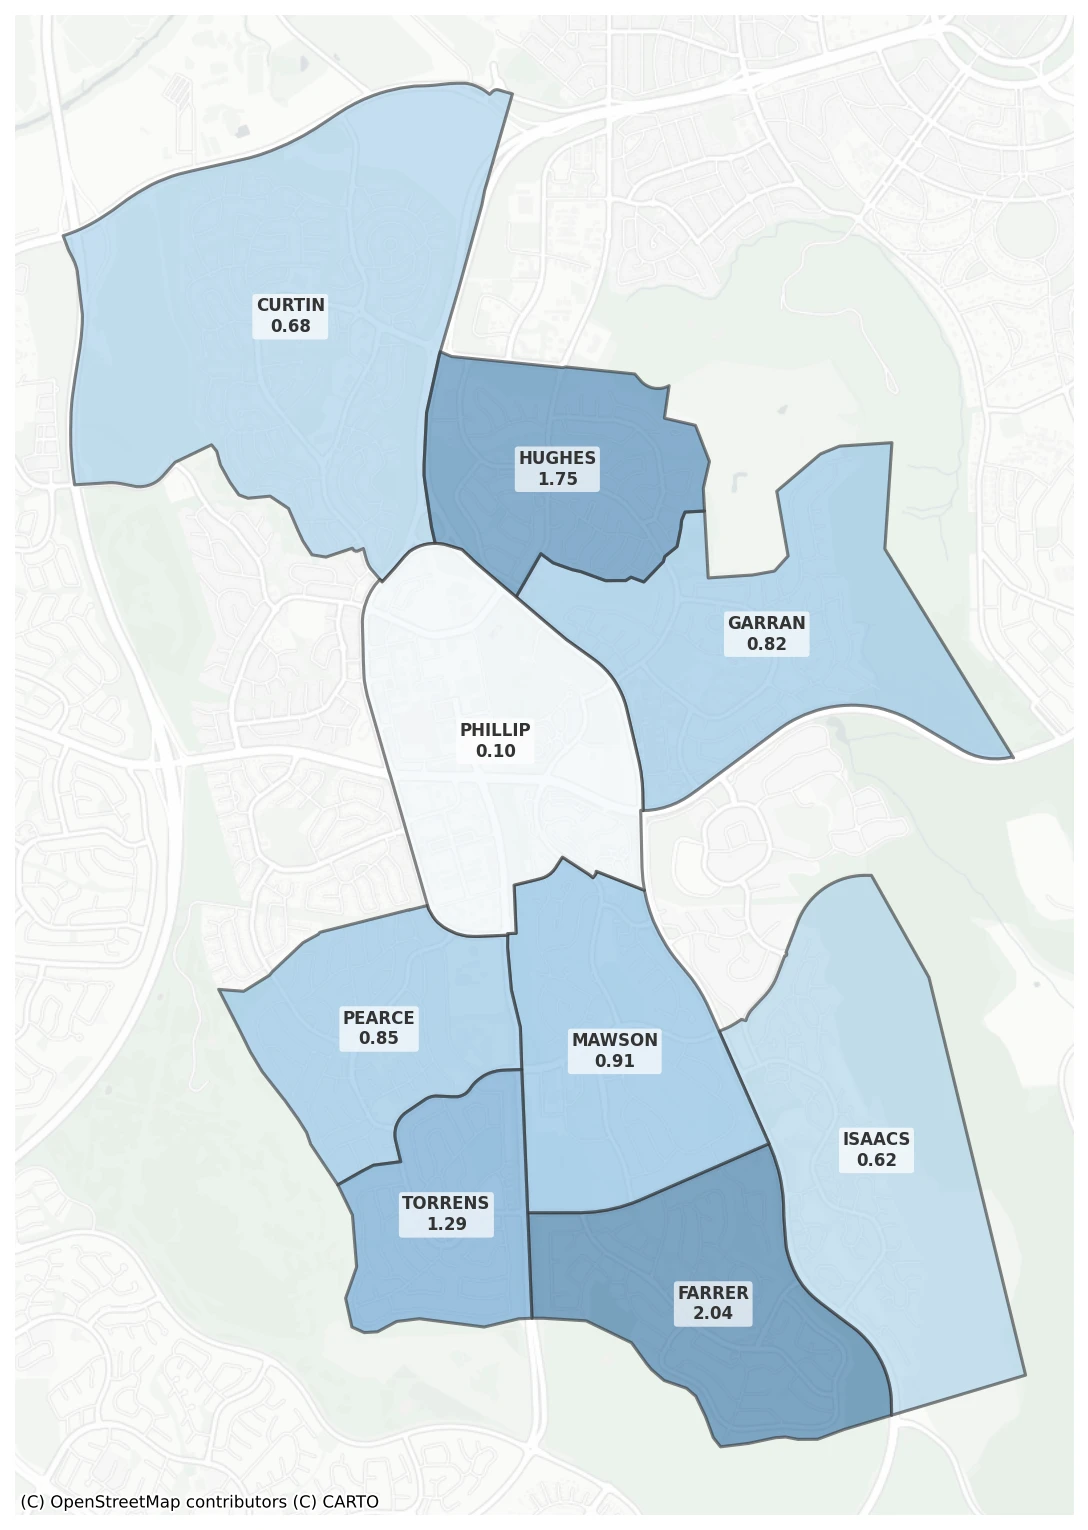
Half of all harm incidents occurred outdoors. Farrer (2.04) and Hughes (1.75) are the highest-rate suburbs; Phillip (0.10) is effectively the safest suburb in the ACT with meaningful service volume (5 services, 403 places).
Molonglo valley
The newest district and the highest harm rate at 1.83. Only 7 services with 775 total places; small samples produce extreme results. Median income $1,446/week, with 23.6% of the population aged 0–14.
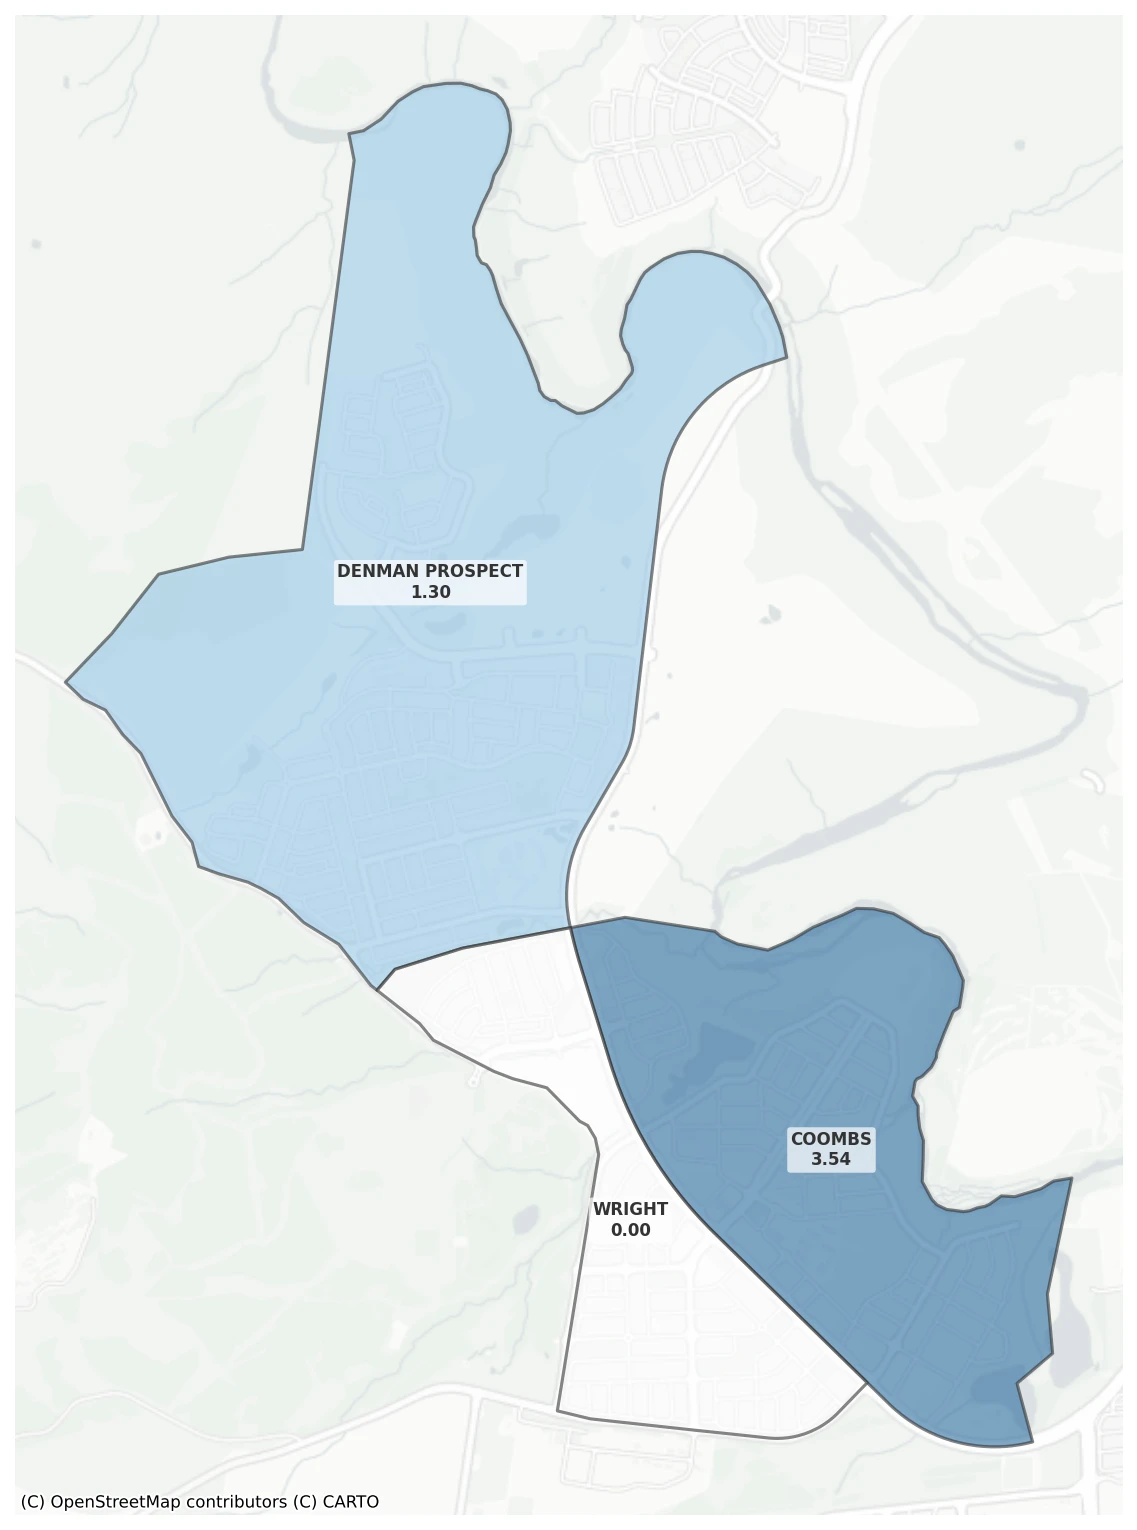
Coombs (3.54) drives most of the district's rate with 64 harm documents across 3 services. Wright recorded zero harm documents. The low recurrence rate (6%) suggests these may be isolated incidents rather than systemic problems, but the small sample makes it hard to draw firm conclusions.
Where incidents happen
The documents tell us something about the circumstances of harm:
- 31% occur outdoors in areas such as playgrounds or outdoor play areas
- 29% involve an adult where a staff member or someone else has been implicated
- 28% involve multiple children which most often represent harm between children
- 14% show recurrence of similar incidents at the same service
- 12% occur in private spaces such bathrooms, nappy change areas
- 5% occur in indoor common areas such main play rooms, bathrooms or cupboards
Outdoor areas are the most common location for harm incidents. Outdoor play involves more physical activity and less direct supervision per child. An example of how these percentages work, one incident described a man coaxing a child with candy through a fence at a service, that document described an incident that implicated an adult in an outdoor setting.
In the below image, dots are documents; the more circumstances they have in common the closer the dots become.
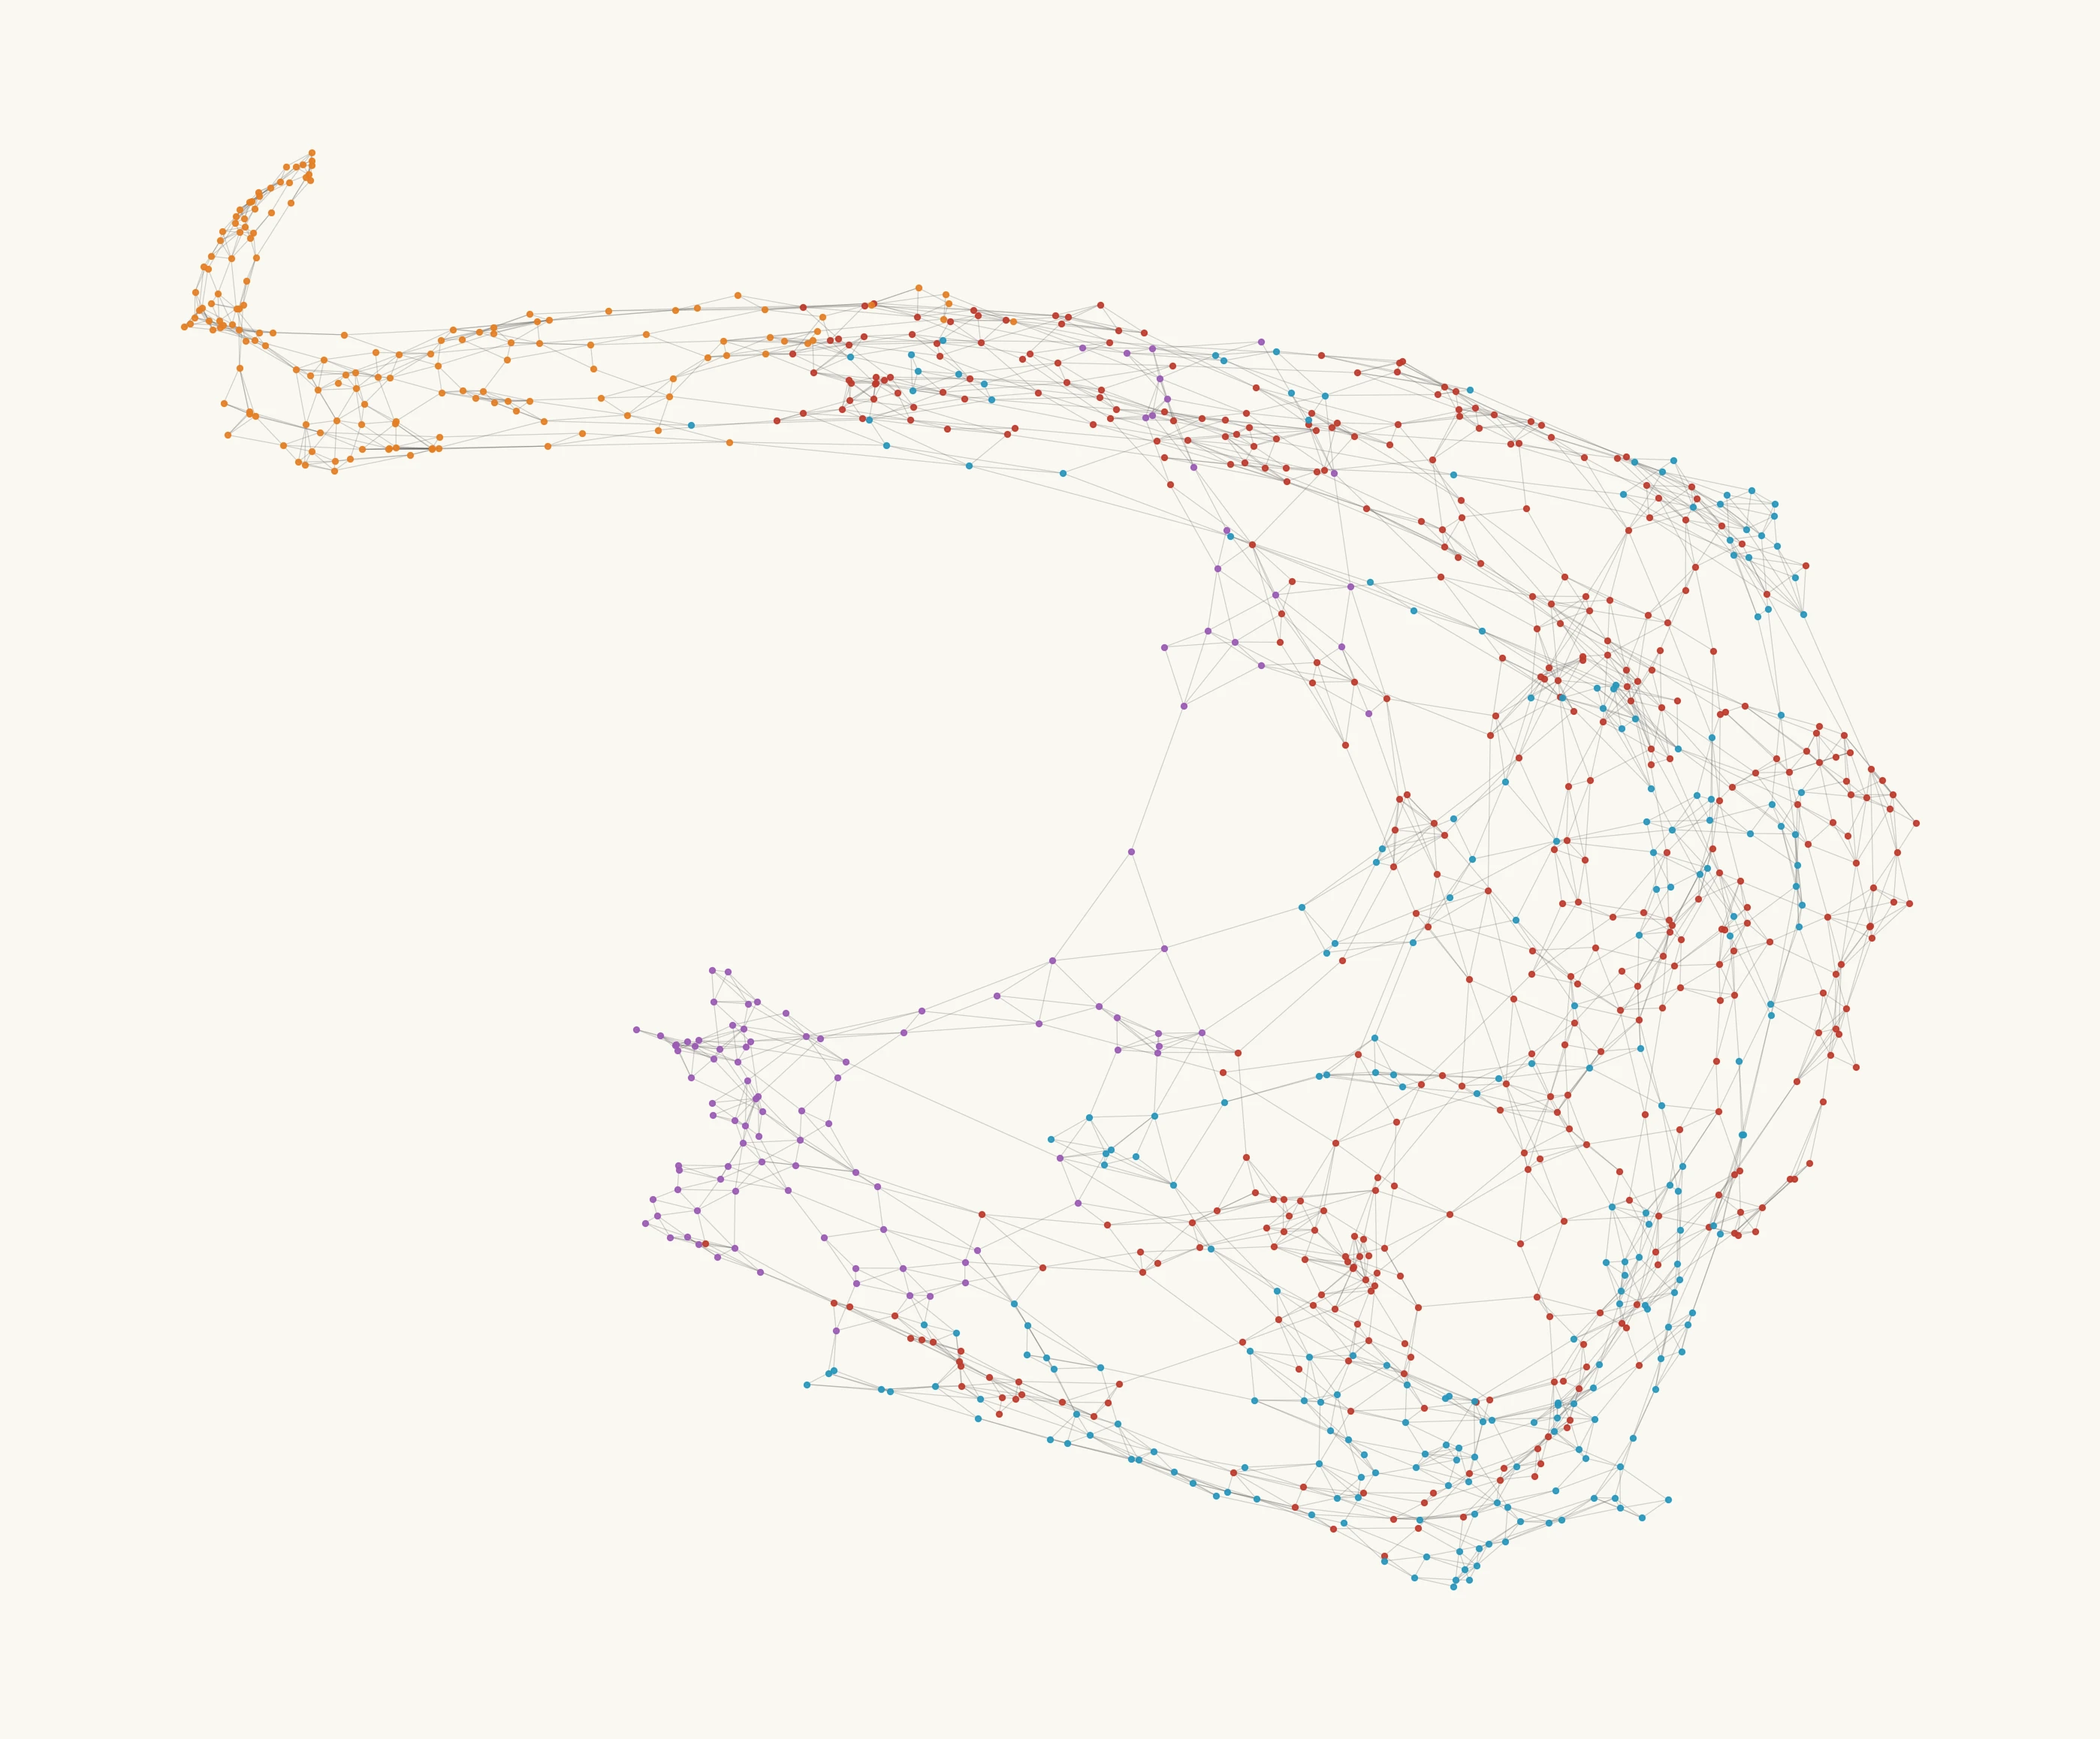
The dots bunched up in the top left-hand side are all carer to child ratio breaches, these incidents tend to be clear cut staffing issues. The other documents are reflecting harm and sexual behaviour (whichever is most prominent determines the colour), these issues are not straightforward and the documents rarely indicate a single root cause.
The regulator's challenge
The ACT's childcare regulator (CECA) faces a difficult job. To provide context to the below
The corporate network is dense.
Large childcare operators run multiple centres under various brand names. A single provider might operate 5-10 services across different suburbs and some obfuscate ownership structures. The below image shows CECA in the centre, the consistent circle of dots around CECA are the documents and the clusters are Services and Providers.
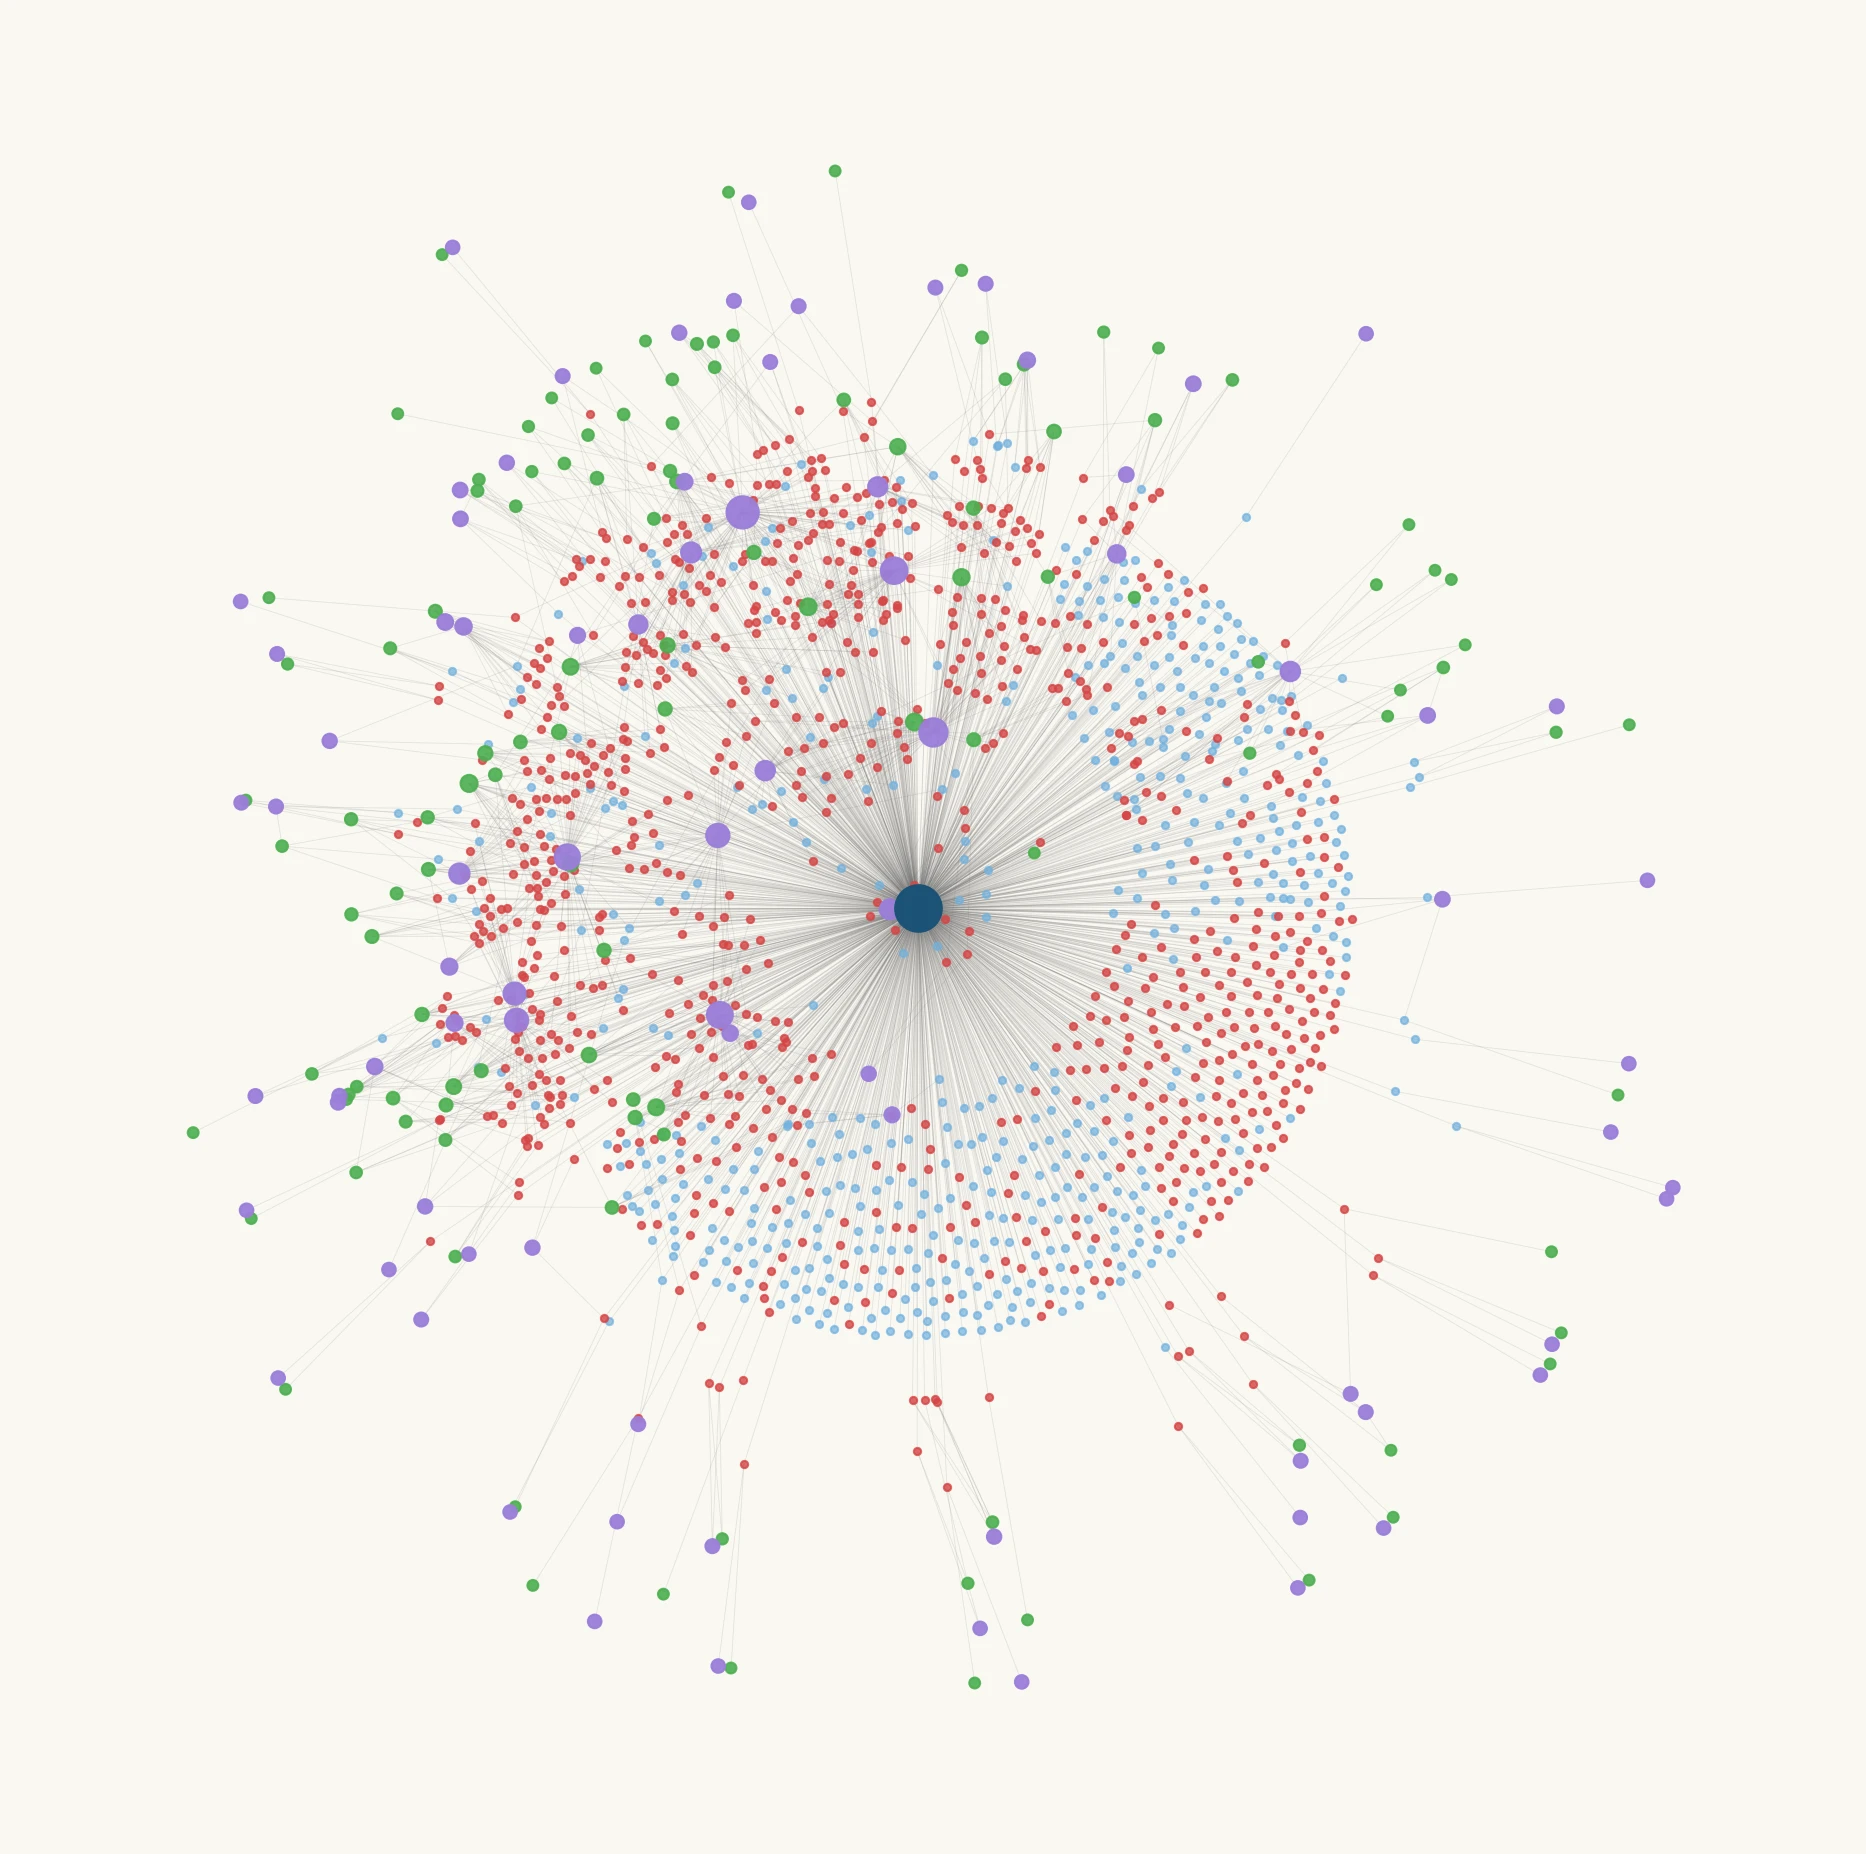
Unfortunately we weren't able to link every document to every provider, however there are clear trends that some providers appear to spend more time managing communication with CECA than uplifiting their business.
The most serious incidents involve many factors. While there were some exceptions, nearly all of the incidents that indicated serious harm included multiple contributing factors. Nearly all incidents that contained violent or sexualised events had multiple contributing failures.
Enforcement rates are low. Only about 10% of regulatory decisions in the corpus apply immediate penalties (suspension, cancellation, prohibition). The remaining 90% are conditional or remediation focused compliance notices, show cause letters, directions with future penalties contingent on non-compliance. This reflects the current regulatory framework of graduating consequences.
While financial penalties were mentioned in most responses from the regulator, the analysis was unable to find an instance of financial penalties being applied to a business. One instance of a financial penalty potentially being applied to an individual was sighted but couldn't be verified within the available data.
A closure is a significant impact. If a centre closed suddenly, the economic impact is significant. This was modelled using the data we had available from the analysis and assuming a 100-place centre closed with short notice in Gungahlin.
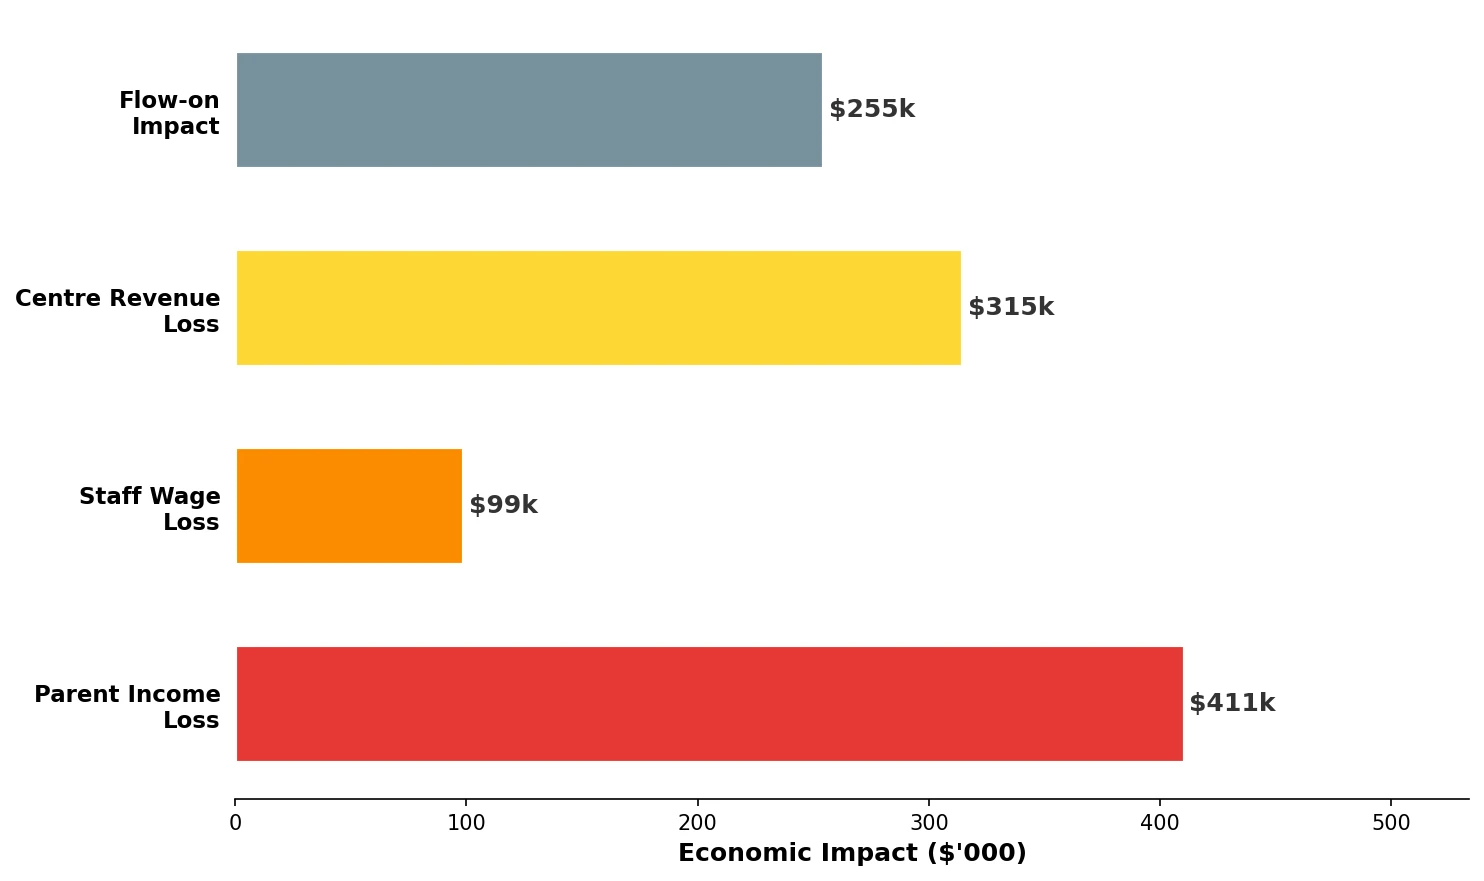
- Parent income loss: ~$136,000 over 6 weeks (lost work days while finding alternatives)
- Staff wage loss: ~$99,000 (15 educators without income)
- Centre revenue loss: ~$315,000
- Flow-on economic impact: ~$117,000
Total: roughly $667,000 in economic disruption from a single centre closure.
The wider consequences are material and CECA have demonstrated a pattern of enforcing temporary or permenant closures in the past. The criteria a child care needs to meet before this kind of action is taken was not evident from the documents released. It is fair to assume that it would require substantial mismanagement on behalf of the child care.
Regulatory theory. CECA's "Educate and Engage" framework is underpinned by responsive regulation theory, which advocates for a proportionate and escalating response combined with aspirational regulation to encourage continuous quality improvement. The approach is common for Australian regulation and in the context of child care protection it means treating the service provider as the primary subject. The consequence is that CECA's framework focuses on how it manages service providers with child safety being a considered factor.
This provides context to the steps we can observe in the documents released, which follow a consistent pattern; 1) education 2) compliance notices 3) directions 4) suspension or cancellation.
Here is the CECA process, as articulated on ACT Governments website at the time of writing: CECA-Educate-and-Engage-Compliance-Framework.pdf
Limitations
This analysis has important caveats:
We only have a subset of documents. The ACT Government released approximately 1,700 documents that the team were able to access. We don't know how documents were selected for release.
Some ratings are stale. About 18% of NQS ratings predate 2020. These are excluded from the NQS analysis so they don't skew results, but the filtered sample is smaller.
Correlation isn't causation. We've identified patterns in the data. We can't prove that low QA6 ratings cause harm—only that they're associated with higher harm rates.
Small samples produce extreme results. Suburbs or districts with few services can show very high or very low rates that may not reflect true risk.
The CECA audits are absent. CECA's framework describes services rated as low risk being audited every 12-18 months and high risk services are visited every 6 months.
Of all limitations, CECA's audit records of high risk services are the biggest gap to completing a picture of child safety in Canberra.
About the analysis
This article is based on analysis of 1,444 regulatory documents released by the ACT Government in early 2026, covering the period 2020-2025.
How we processed the documents:
- Extracted text from PDFs using Womblex
- Used the Isaacus Kanon-2 Enricher to identify services (SE-XXXXX), providers (PR-XXXXX), and incident references (NOT-XXXXXXXX, CAS-XXXXXXXX)
- Classified documents by topic using semantic similarity
- Linked documents to services using three methods: direct references, provider resolution, and name matching
- Merged with external data: ACECQA registers for service details, ABS Census for demographics, ACT Policing for crime statistics, GNAF for address mapping
The full methodology is available in our technical writeup.
A closing note from the team
This topic is far from what the team had in mind when the project started. We aim to reduce the barrier to innovation based on Open Data and where possible, provide education with a side of entertainment. We can't commit to these types of activities consistently, but we'll continue to welcome community suggestions aligned with the project goals.
Last updated: March 2026