The shape of Australian open data
The following is an overview of the data sets you can discover in DeepCivic and is a reasonable reflection of Australia's open data landscape.
 Top 20 publishing organisations
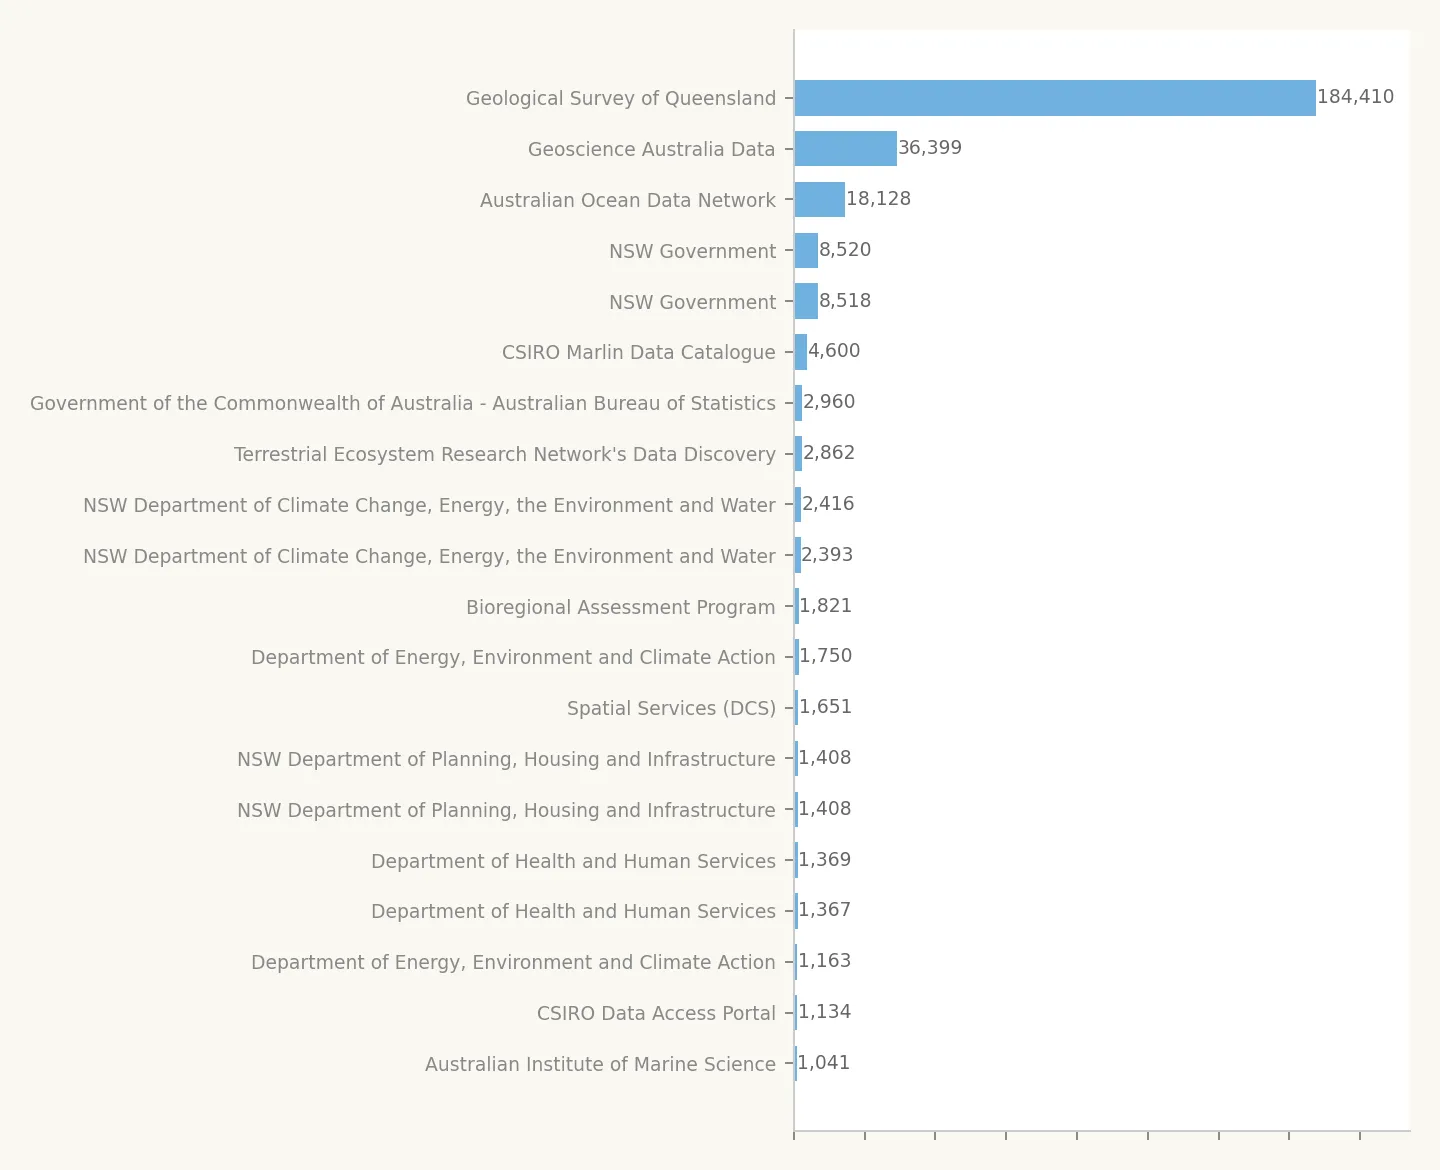
The Geological Survey of Queensland accounts for 184,410 datasets, reflecting QLD's practice of registering individual geoscience survey products as separate CKAN datasets. If anyone from the Geological Survey of Queensland is reading this, please stop. You've won, most countries can't hope to post so many datasets. Geoscience Australia (36,399) and the Australian Ocean Data Network (18,128) round out the top three, all earth-science agencies.
NSW Government appears twice (8,520 and 8,518) because the same publisher exists as distinct organisation records on both the federal and NSW portals. The same is true for NSW Department of Climate Change (2,416 + 2,393), NSW Planning (1,408 + 1,408), Department of Health and Human Services (1,369 + 1,367), and DEECA (1,750 + 1,163). These duplicates are a direct consequence of federation.
Every organisation in the top 20 exceeds 1,000 datasets. Below that threshold sits a long tail of 1,600+ organisations, most with fewer than 50 datasets each.
 Native portal datasets vs federated copies
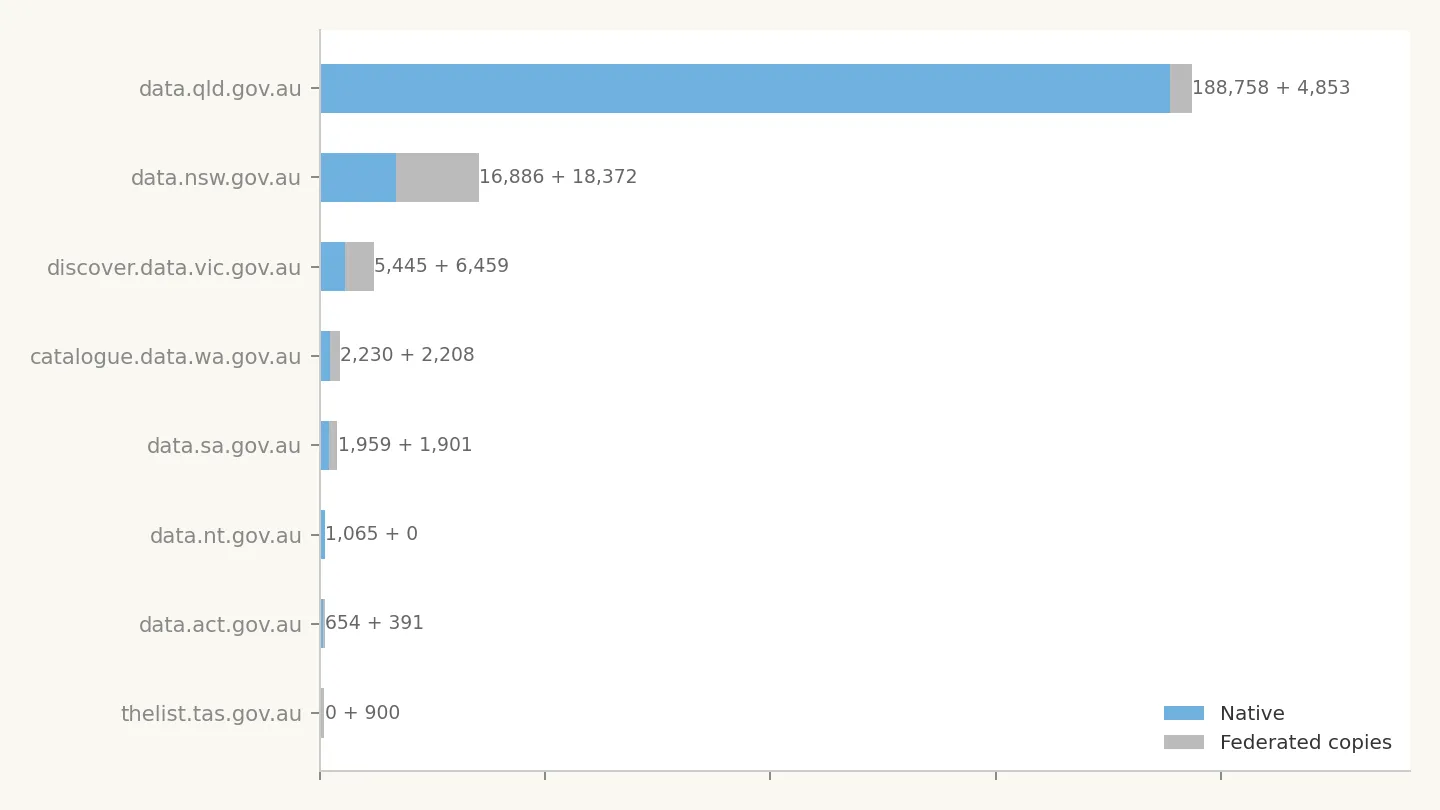
This chart compares datasets held natively on each state/territory portal against federated copies of their data held on data.gov.au. The format is native + federated.
QLD's dominance is overwhelming (188,758 native) but its federation footprint is modest (4,853 copies on federal). By contrast, NSW has near-parity: 16,886 native datasets and 18,372 federated copies; meaning the federal portal actually holds more NSW records than NSW's own portal. Victoria, WA, and SA all show roughly 1:1 native-to-federated ratios, suggesting almost full mirroring onto data.gov.au.
Tasmania is an outlier: 0 native datasets (the portal hasn't been harvested yet because Tasmania makes it harder than anyone else) but 900 federated copies already visible on the federal portal. The NT has no federated copies at all based on our analysis.
This has implications for deduplication. A naive count of "Australian open datasets" would substantially overcount without accounting for federation.
 Datasets by year: created vs last modified
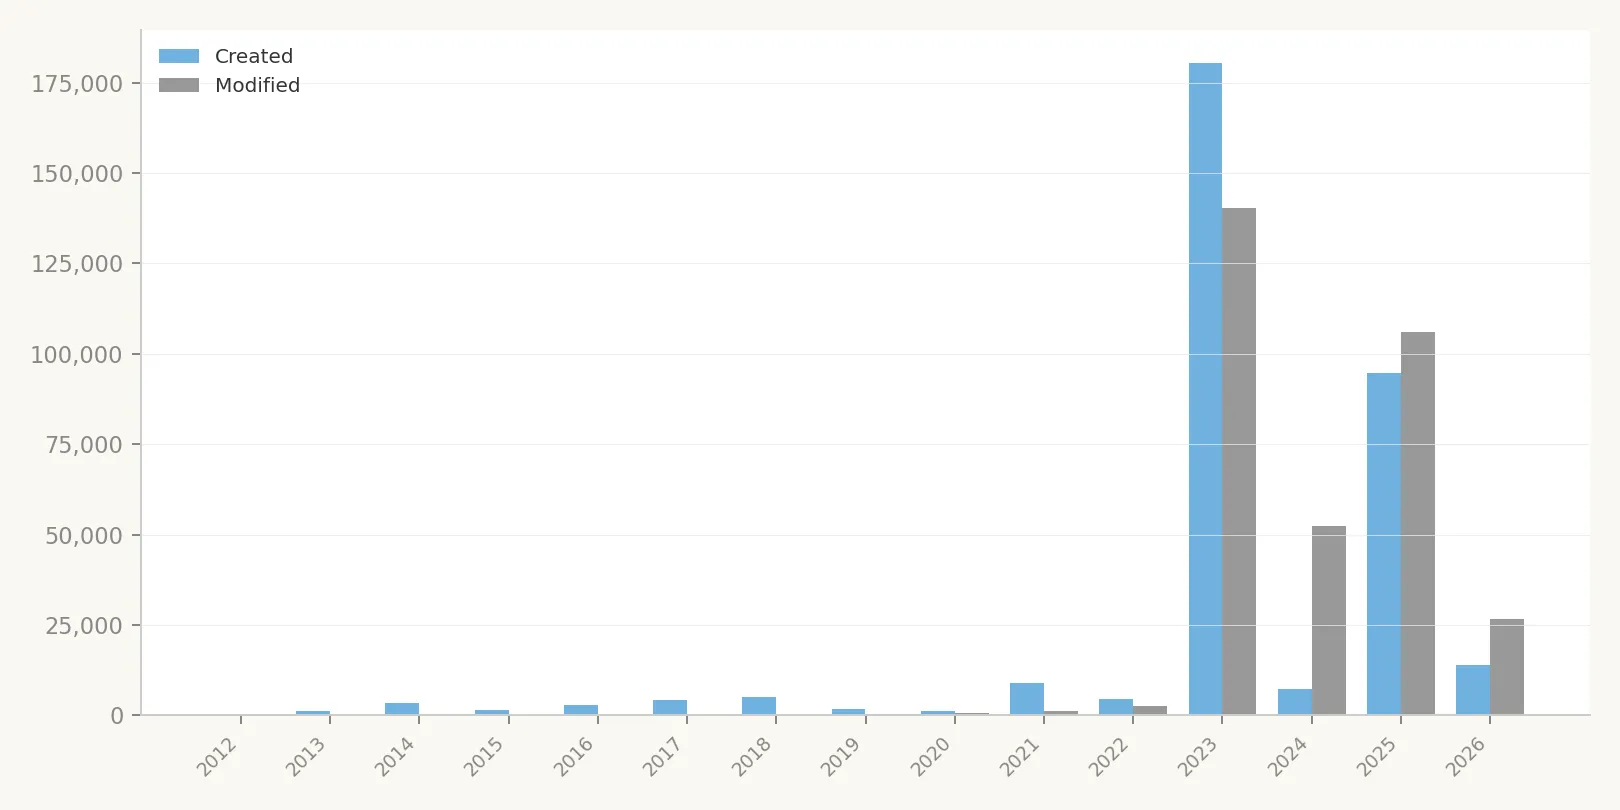
Dataset creation spiked dramatically in 2023, driven almost entirely by the QLD geological survey bulk-loading ~180,000 records. Before that, annual creation was modest (1,000-10,000/year from 2012-2022).
The "Modified" series tells a different story. Modifications are distributed more evenly across 2023-2025, indicating that existing datasets are being updated regularly. The 2024 and 2025 modification bars (53,000 and 106,000 respectively) exceed their creation bars, confirming active maintenance of existing records. The 2026 bar reflects partial-year data (harvested through March 2026).
The gap between creation and modification dates can be read as a rough "data freshness" indicator: most datasets created in 2023 have since been modified at least once.
 Licensing: open vs not open vs not specified
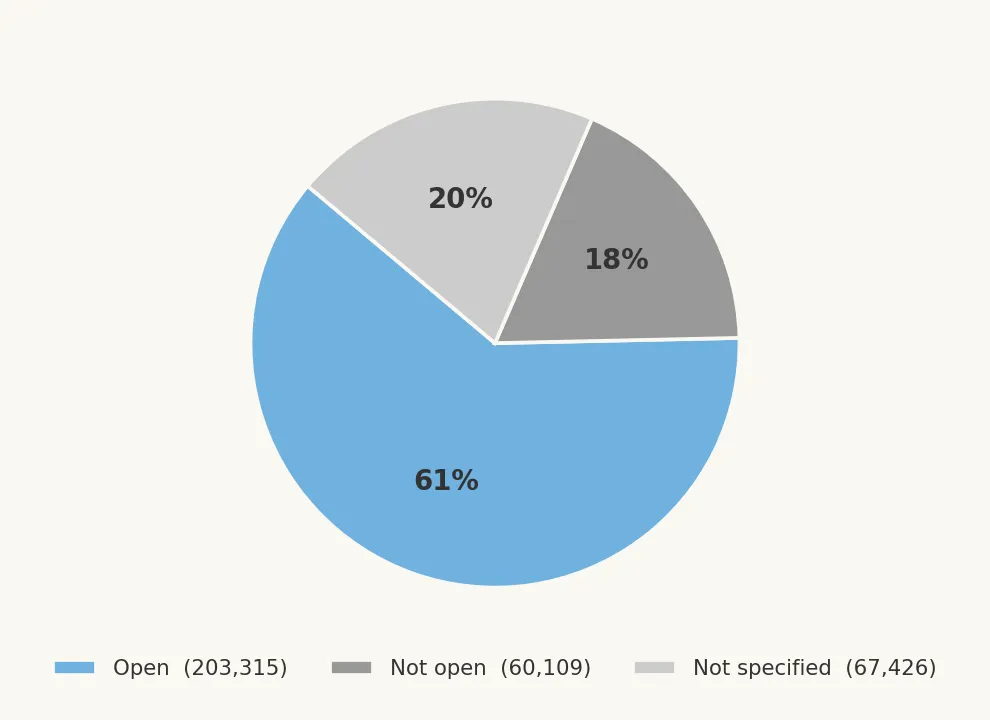
61% of datasets (203,315) are flagged as open with a specified license; predominantly CC-BY 4.0. The majority of Australian government data is formally licensed for reuse.
However, 20% (67,426) have no license specified at all. They're published on open data portals, implying intent to share, but without an explicit license, downstream reuse is legally uncertain. This gap is concentrated in the federal portal's older records.
The remaining 18% (60,109) carry a license but are not flagged as open. This includes restrictive Creative Commons variants (CC-BY-NC, CC-BY-SA), custom government licenses, and records explicitly marked as restricted access.
 Top 10 resource formats
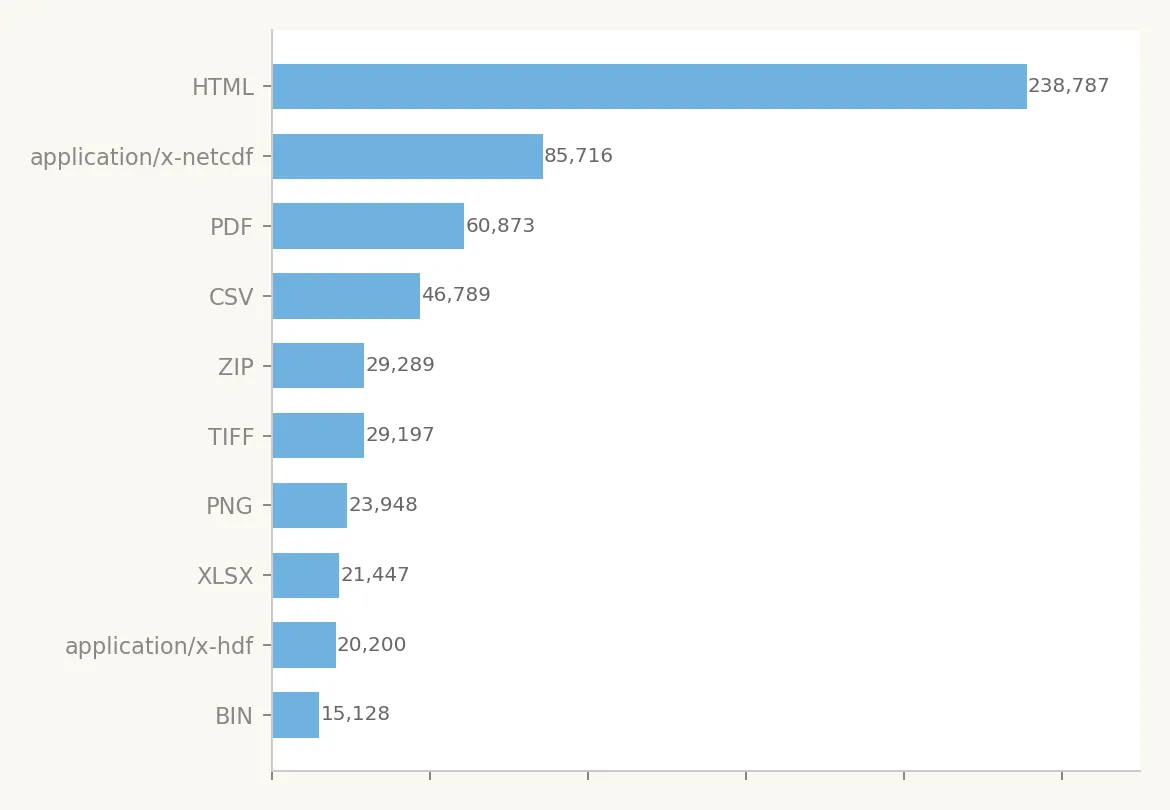
HTML dominates at 238,787 resources, these are typically landing pages or metadata pages linked as "resources" rather than downloadable data files. This is a CKAN convention rather than a reflection of actual data format. First prize is technically a non-entrant.
The second-place format, application/x-netcdf (85,716), reflects the heavy geoscience and oceanographic content in the catalogue. NetCDF is the standard container for gridded scientific data (climate models, bathymetry, satellite imagery).
PDF (60,873) ranks third, a significant proportion of government "data" is still published as static documents rather than machine-readable formats. No points awarded if you can guess where DeepCivic's attention will be turning too next.
CSV (46,789) is the first truly machine-readable tabular format, ranking fourth. This is the format most useful to general-purpose data consumers, yet it represents only ~7% of total resources.
The presence of TIFF (29,197), PNG (23,948), and HDF (20,200) further underscores the geospatial and scientific character of the catalogue. ZIP archives (29,289) likely contain bundled shapefiles or multi-file datasets. XLSX (21,447) rounds out the tabular formats.
BIN (15,128) is a catch-all for binary files without a more specific MIME type. Many of these might as well be in the bin until they're brought into a standard format alongside other data sets.
Last updated: March 2026