 About
About
This is the technical methodology for the DeepCivic investigation into childcare regulatory compliance in the Australian Capital Territory. It accompanies the parent article, How to Choose Child Care in Canberra.
The investigation analyses 1,444 regulatory documents released by the ACT Government covering childcare incidents, complaints, and enforcement actions from 2020 to 2025.
 Pipeline steps
1. PDF extraction
Womblex (pdfplumber-based) extracts text blocks in reading order, detects tables, and captures filename metadata.
Input: 1,700+ PDFs | Output: 1,518 text documents
2. Cleaning
Removed: corrupted files, empty documents, cover pages, index documents, duplicates (by document ID).
Output: 1,444 documents
3. Chunking
Semchunk splits long documents into smaller pieces that fit the enrichment model's context window. It uses semantic boundaries (paragraph breaks, then sentence boundaries) to avoid splitting mid-thought.
Configuration: isaacus/kanon-2-tokenizer, target 480 tokens, 512-token context window.
4. Entity enrichment
Kanon-2 Enricher extracts structured information from each document:
- Service IDs:
SE-\d{5,} - Provider IDs:
PR-\d{5,} - Notification refs:
NOT-\d{8} - Case refs:
CAS-\d{8}orCA-\d{8} - Person names, dates, locations
- Document structure (sections, paragraphs)
Output format: Isaacus Legal Graph Schema (ILGS)
5. Document embeddings
Kanon-2 Embedder produces 768-dimensional vectors per document. Documents about similar topics produce similar vectors.
Similarity measure: cosine similarity
6. Topic classification
Centroid-based classification:
- Manually select 3–5 clear example documents per topic
- Compute centroid:
mean(embeddings[seed_docs]) - Score each document:
cosine_similarity(doc_embedding, centroid) - Flag top 25% as positive for that topic
The seed documents that define each category are recorded in semantic_tag_examples.csv.
Topics:
| Category | Tags |
|---|---|
| Enforcement | penalty_applied, conditional_direction |
| Harm | physical_harm_occurred, sexual_behaviour |
| Supervision | supervision_failure, ratio_breach |
| Pattern | adult_alleged, recurrence_documented, multiple_children |
| Location | outdoor, indoor_common, private_spaces |
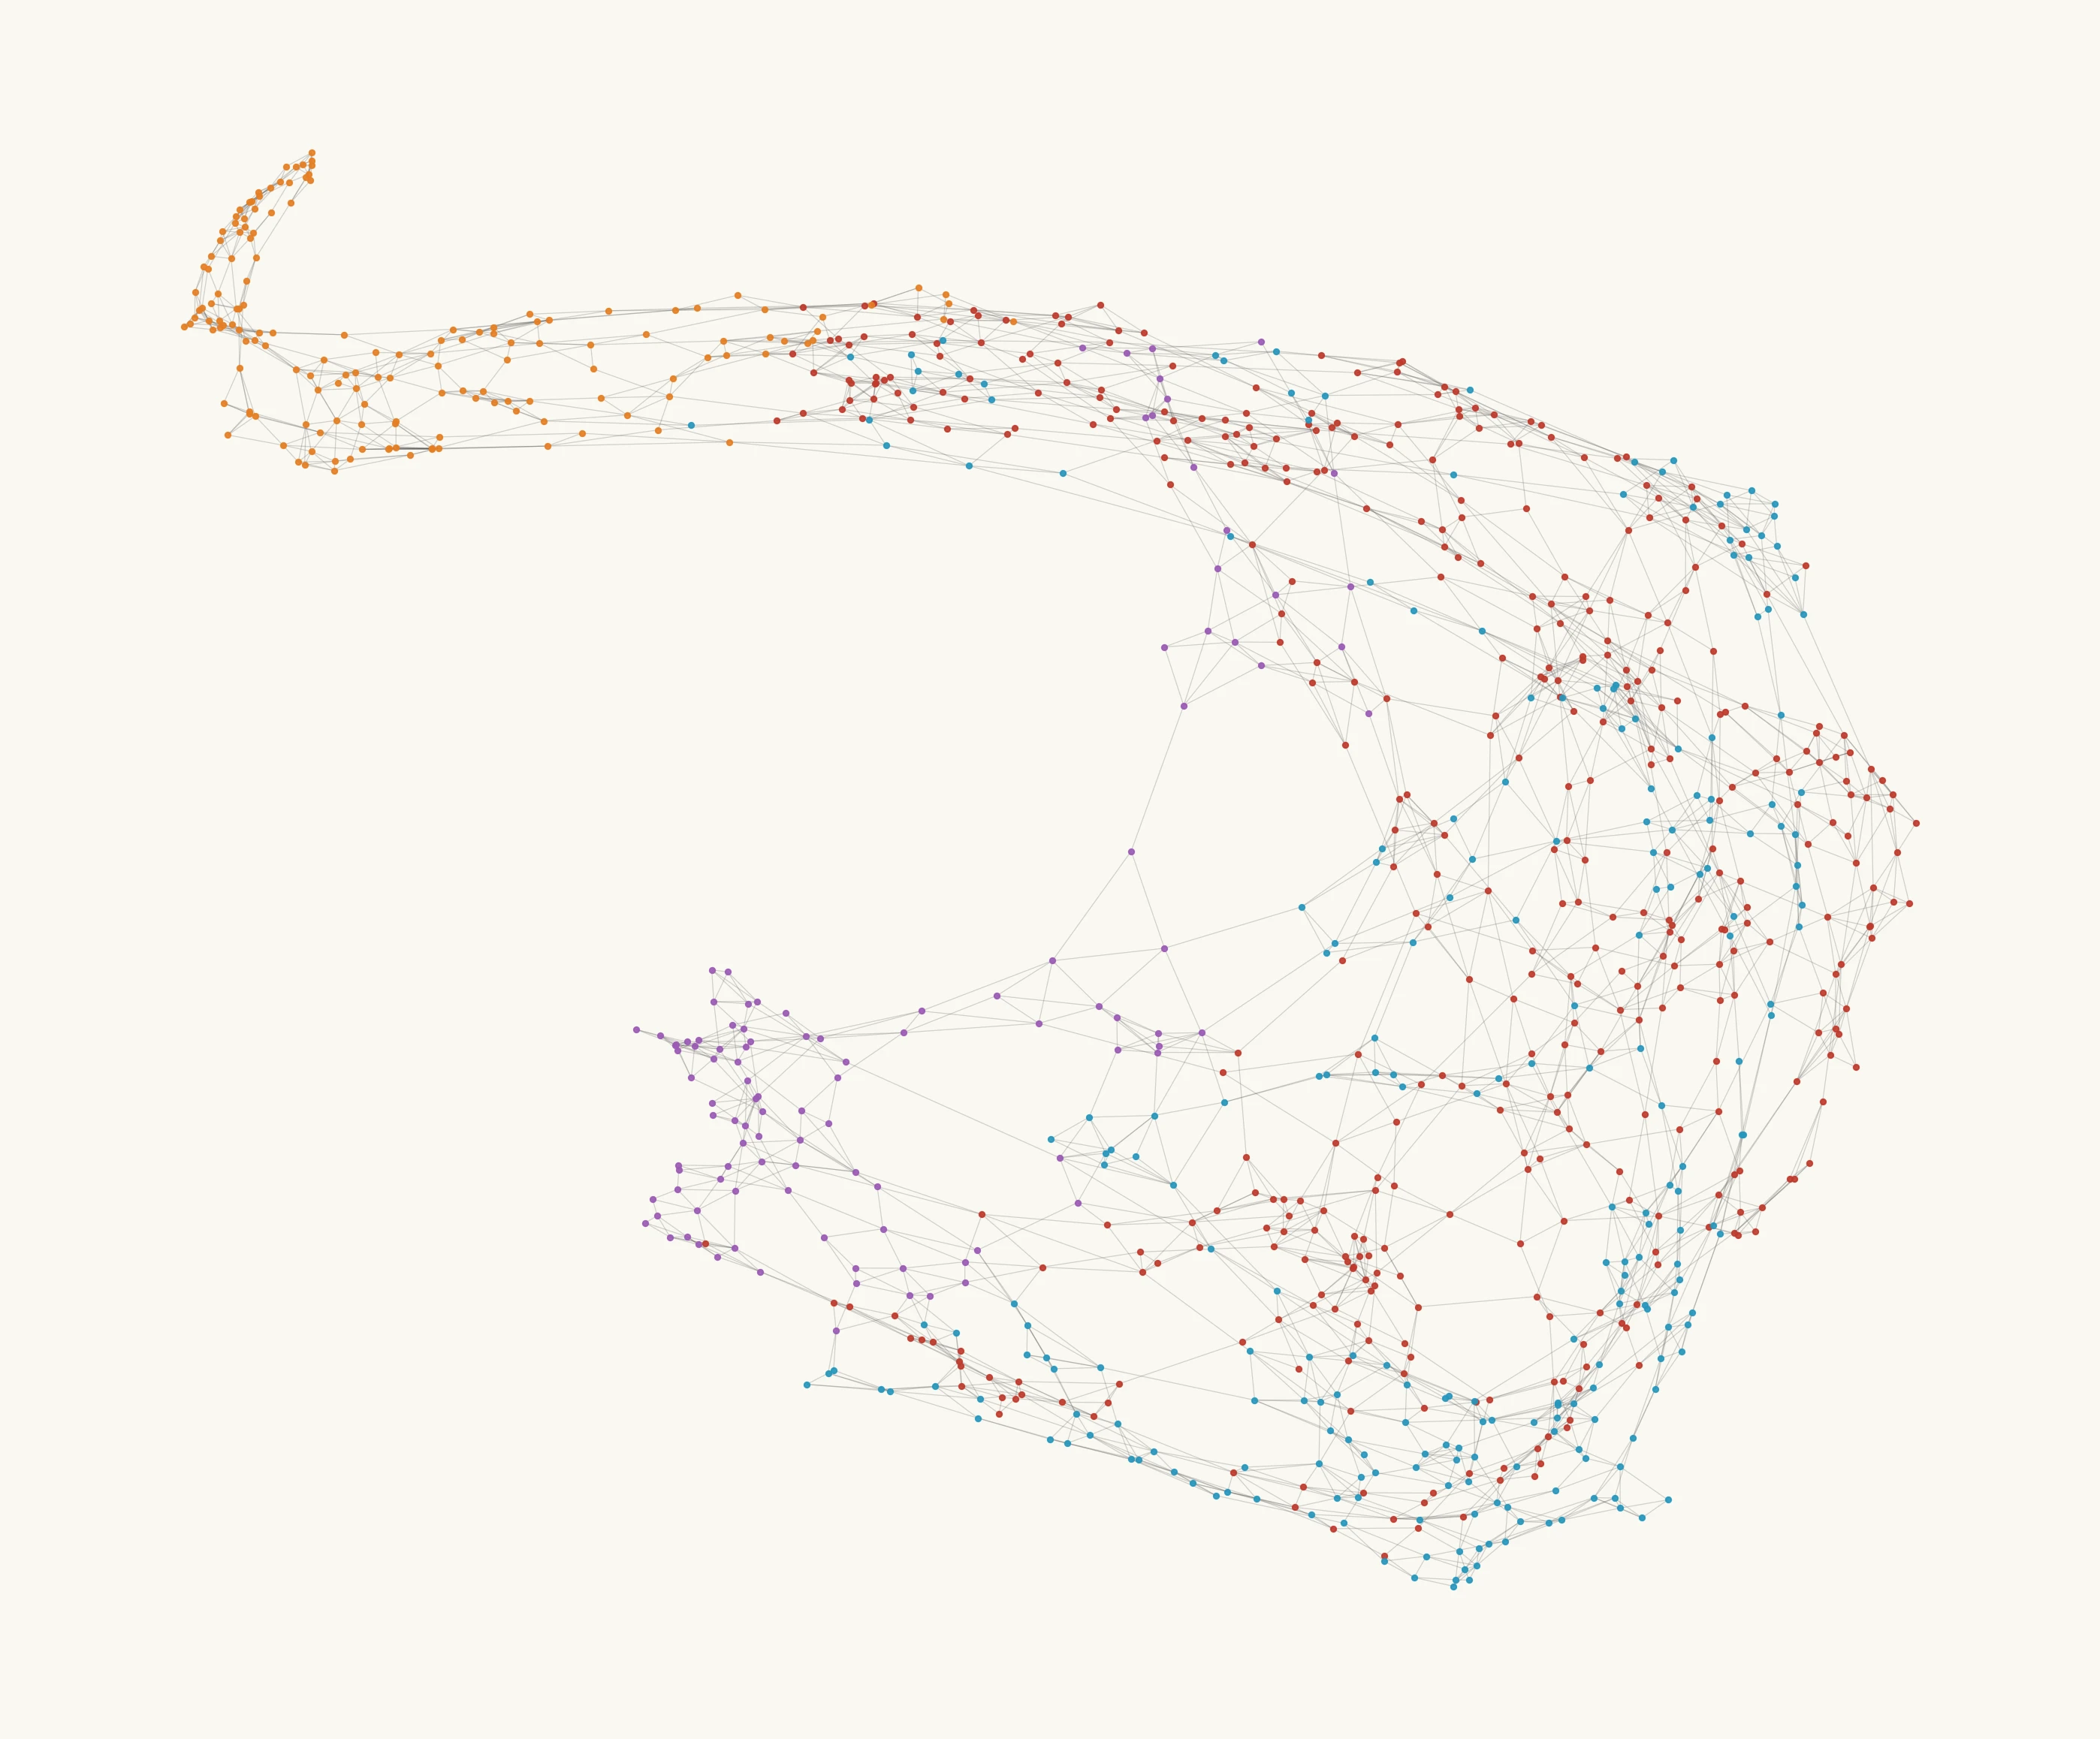
7. Graph construction
Two graph structures built from enrichment entities:
Bipartite graph:
- Nodes: documents (1,444), entities (1,142 — notifications, services, providers, cases)
- Edges: document mentions entity (2,300 edges)
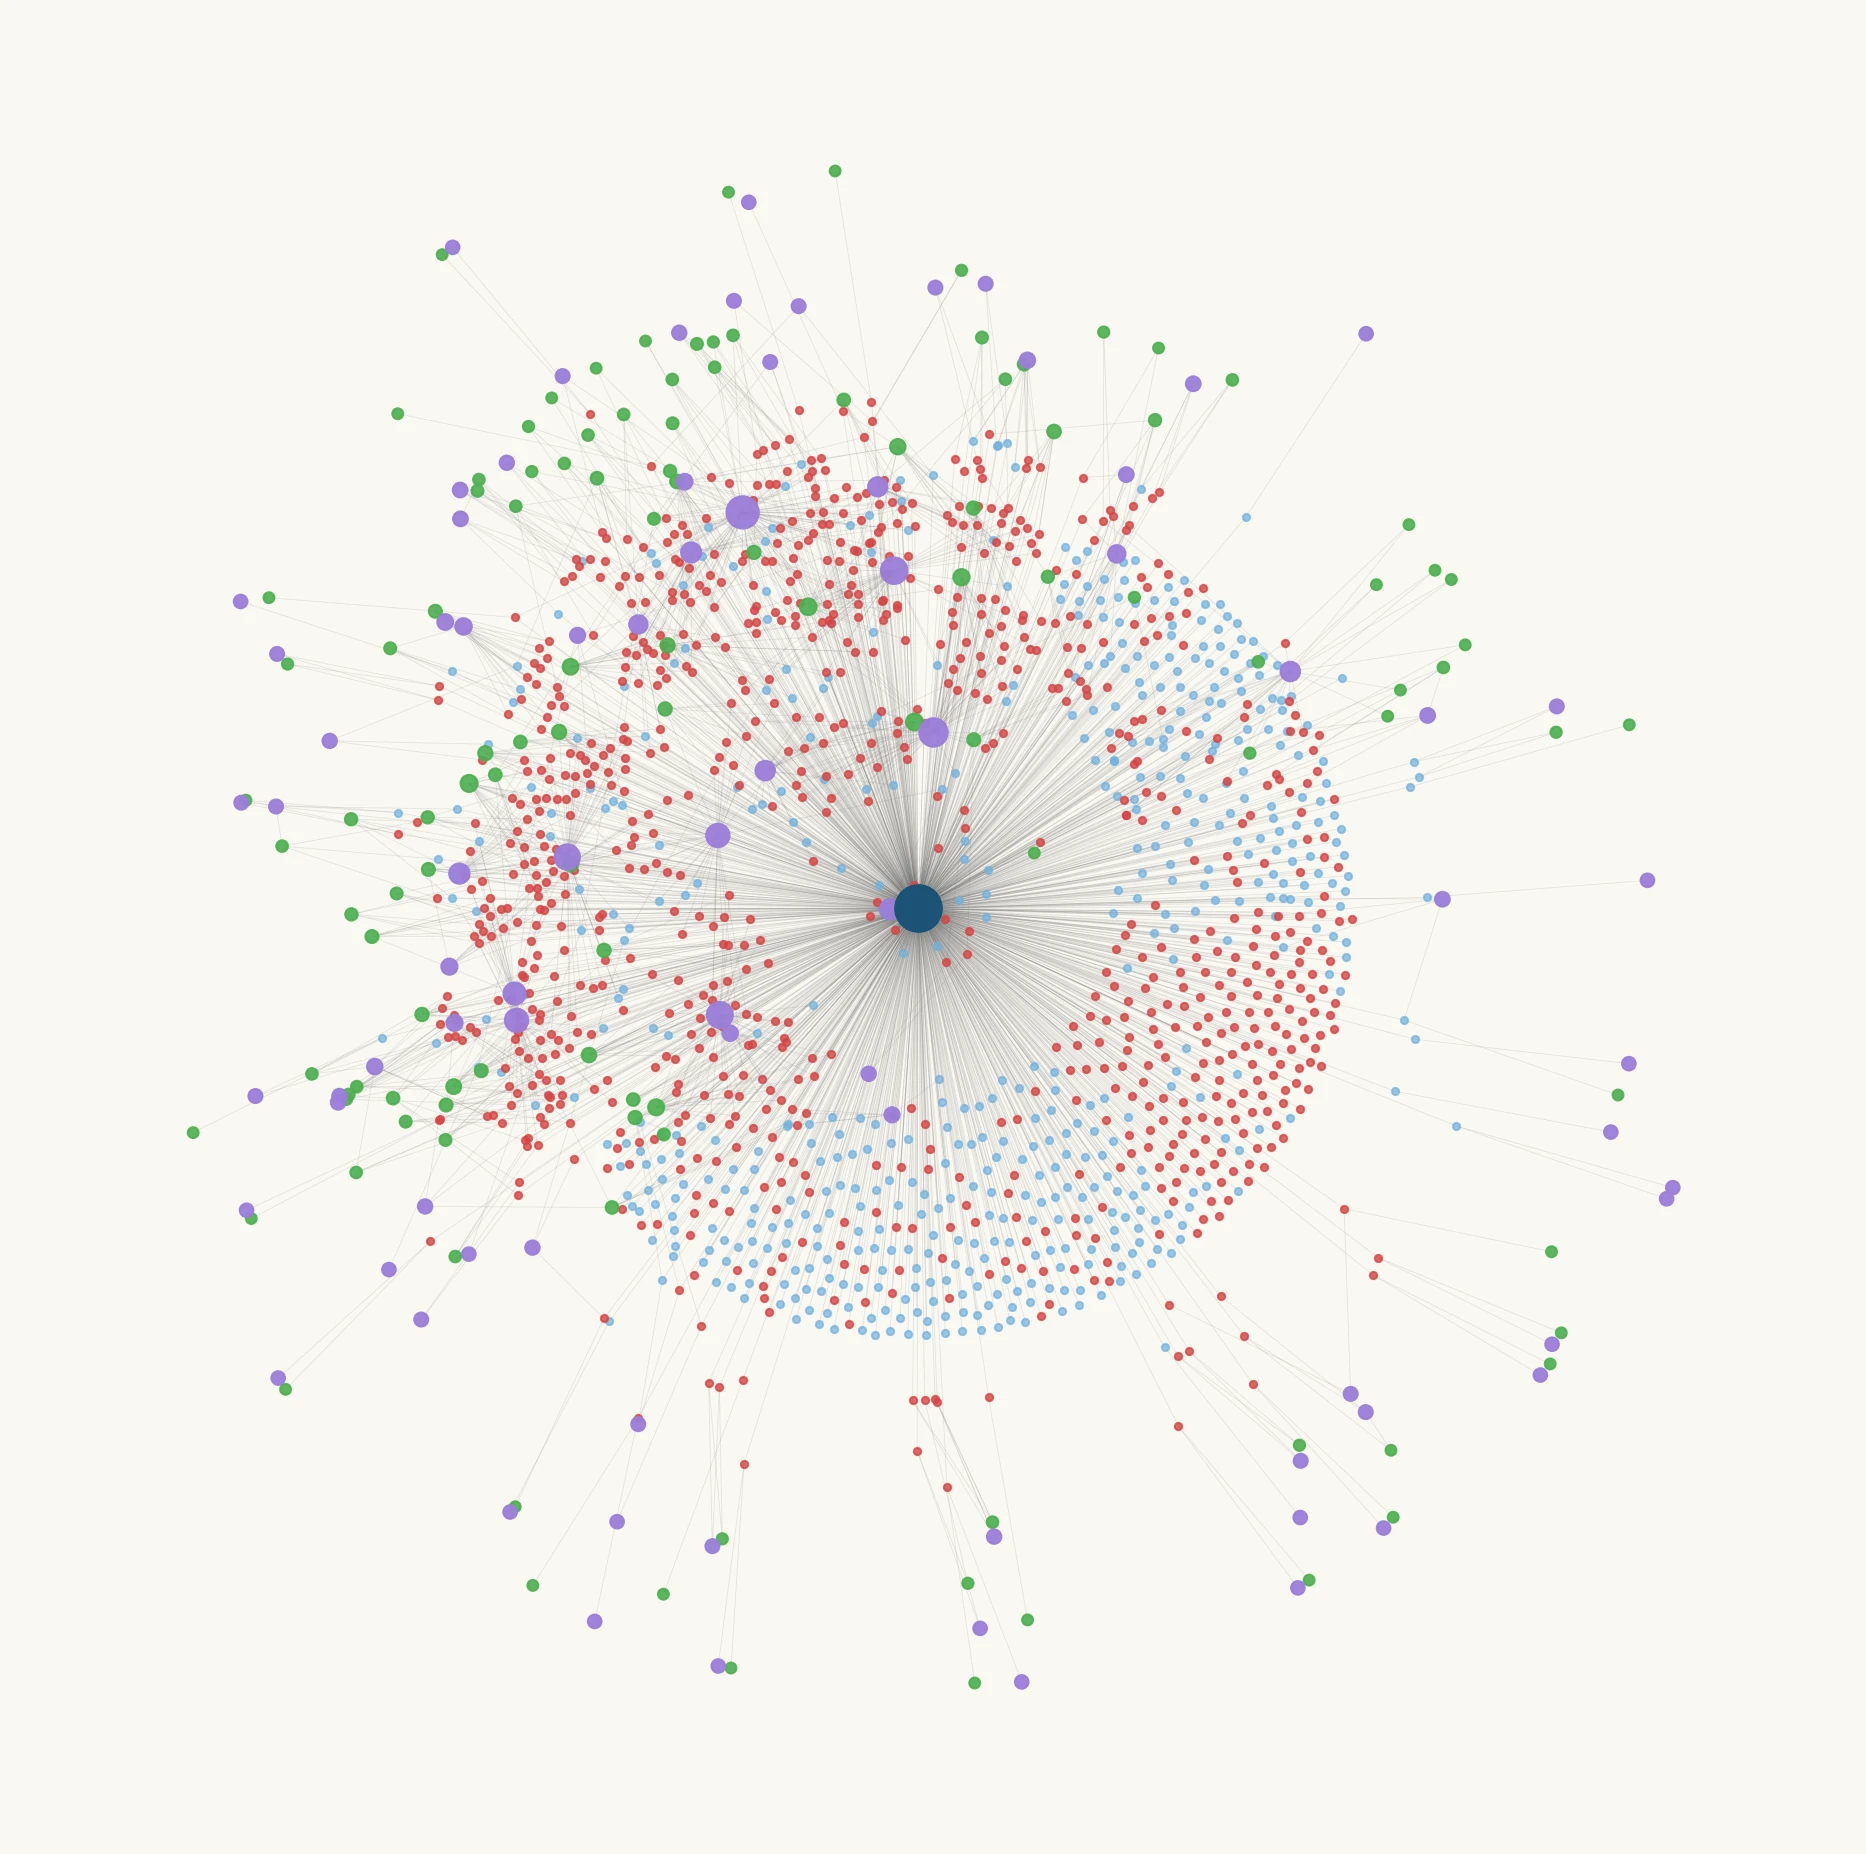
Document graph:
- Nodes: documents (1,444)
- Edges: documents share entity reference (11,368 edges, 737 connected components)
8. Document-service linking
Many documents lack explicit SE-XXXXX references. We use three strategies to maximise linkage:
| Strategy | Method | Confidence | Documents Recovered |
|---|---|---|---|
| SE reference | Direct SE-XXXXX in document | High | 546 (baseline) |
| Provider resolution | PR-XXXXX → lookup services | High | +143 |
| Name matching | Service name in text (min 12 chars) | Moderate | +186 |
Total linked: 875 documents (60.6% of corpus). The remaining 569 documents (39.4%) are orphans that cannot be attributed to a specific service location.
9. External data merge
| Source | Fields Used |
|---|---|
| ACECQA registers | Capacity, NQS ratings (overall + QA1–7, filtered to 2020+), service type, location |
| StartingBlocks/Toddle | Daily fees |
| ABS Census 2021 | SA2 population, median income |
| ACT Policing | Assault and sexual offence counts by suburb (2020 Q1 – 2025 Q2) |
| GNAF | Address → SA2 mapping |
10. Harm rate calculation
Harm definition:
harm_indicated = flag_physical_harm_occurred OR flag_sexual_behaviour
Pooled harm rate:
harm_rate = sum(harm_docs) / sum(capacity) × 100 / years
Where:
harm_docs= count of documents withharm_indicated = Truecapacity= licensed places (not enrolled children)years= 5 (2020–2025)- Result = harm documents per 100 places per year
Pooled rates weight by exposure (child-places), not by service count. This answers the parent-relevant question: "For a randomly selected child-place in this category, what's the expected harm rate?"
11. Geographic aggregation
SA2 mapping via GNAF address matching. District assignment from SA2 → district lookup table.
Aggregation: sum harm_docs and capacity per SA2/district, then apply pooled rate formula.
12. Correlation analysis
Categorical variables: Group by attribute (NQS rating, service type, capacity band), calculate pooled rate per group. NQS ratings issued before 2020 are excluded. Services with stale ratings have their NQS columns nulled and are omitted from NQS groupings (but still included in non-NQS analyses).
Continuous variables: Pearson correlation coefficient between SA2-level harm rate and variable (income, crime rates).
Signal strength (based on service count in each group):
| Services | Signal |
|---|---|
| < 5 | very_weak |
| 5–14 | weak |
| 15–29 | moderate |
| ≥ 30 | strong |
13. Enforcement classification
Same centroid approach as topic classification, applied to regulatory decision documents.
Categories:
- Immediate penalty: suspension, cancellation, prohibition
- Conditional/remediation: compliance notice, show cause, directions
 Privacy handling
- Extract person names from enrichments
- Filter out: pseudonyms in source ("Child A", "Educator 1"), role labels, business names
- Generate pseudonymisation register: real name → "Person N"
- Register stored in
DO-NOT-PUBLISH/and not released
 Data flow
Stage 1 — document processing
flowchart TD
    A[1,700+ PDFs from 213A] --> B[Womblex extraction]
    B --> C[1,518 raw text documents]
    C --> D[Deduplication & filtering]
    D --> E[1,444 usable documents]

    E --> F[Semchunk]
    E --> J[Kanon-2 Embedder]

    F --> G[Kanon-2 Enricher]
    G --> H[Entity extraction]
    G --> I[Document structure]
    H --> Y[PII register]

    J --> K[768-dim vectors]
    K --> M[Centroid classification]
Stage 2 — linking & external data
flowchart TD
    O[ACECQA registers] --> P[Master services]
    Q[StartingBlocks / Toddle pricing] --> P
    R[ABS Census 2021] --> P
    S[ACT Policing stats] --> P
    T[GNAF addresses] --> P
Stage 3 — analysis & output
flowchart TD
    N[Document-service links] --> U[Harm rate calculation]
    P[Master services] --> U

    U --> V[Geographic aggregation]
    U --> W[Correlation analysis]
    U --> X[Visualisations]
 Tools
Tools
| Tool | Purpose |
|---|---|
| Womblex | PDF/Excel/CSV extraction to parquet |
| semchunk | Semantic chunking for enrichment context windows |
| Isaacus Kanon-2 Enricher | Entity extraction, document structure |
| Isaacus Kanon-2 Embedder | Document embeddings (768-dim) |
| pandas, numpy | Data manipulation |
| networkx | Graph construction |
| geopandas, contextily | Geographic mapping |
| matplotlib | Visualisation |
 Limitations
Selection bias. We only have documents the government chose to release. The full corpus may contain 20,000+ documents. We do not know the criteria used to select documents for release.
Document counts. While we tried to account for this in most cases, it's likely that some documents do not reflect unique incidents.
Price data gaps. Not all services have pricing data available. We used ACT averages where data was missing, which may mask price variation.
Capacity vs enrolment. Rates use licensed capacity (maximum places), not actual enrolled children. True exposure rates would require enrolment data we don't have.
Small samples. Many suburbs have only 1–3 services. Extreme rates in these areas may reflect statistical noise rather than genuine risk differences.
Correlation does not imply causation. Associations between harm rates and NQS ratings, demographics, or crime rates do not establish causal relationships.
Last updated: March 2026